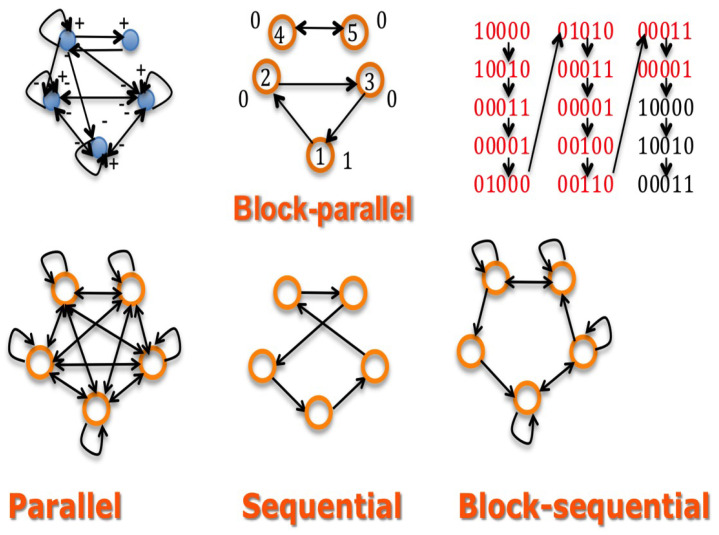
Figure 2.
Top left: interaction graph of a network made of a 3-switch (system made of three genes fully inhibited except the auto-activations) representing morphogens linked to a regulon representing chromatin clock genes. Top middle: the updating graph corresponding to a block-parallel dynamics ruling the network. Top right: a part of the trajectory graph exhibiting a limit-cycle of period 12 having internally a cycle of period four for the chromatin clock genes. Bottom: updating graphs corresponding successively (from the left to the right) to the parallel, sequential and block-sequential dynamics.

