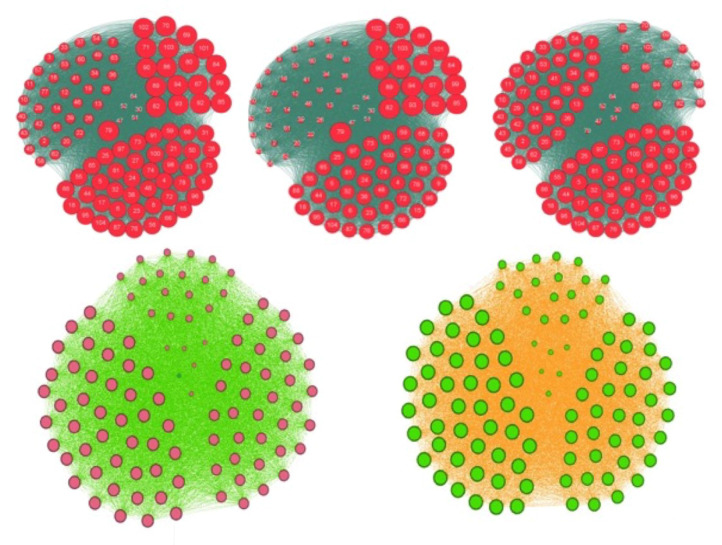
Figure 8.
Top: representation of the whole graph of the French high school. The size of the nodes corresponds to their centrality in-degree (left), eigenvector (middle) and total degree (right). Bottom: threshold for a therapeutic education leading back to the normal weight state the N obese individuals having the entropic centrality maximum: after stabilization of the social network dynamics, we get all individuals overweight or obese in red (left) if N = 20 and all individuals normal in green (right) if N = 21, this number constituting the success threshold of the education.

