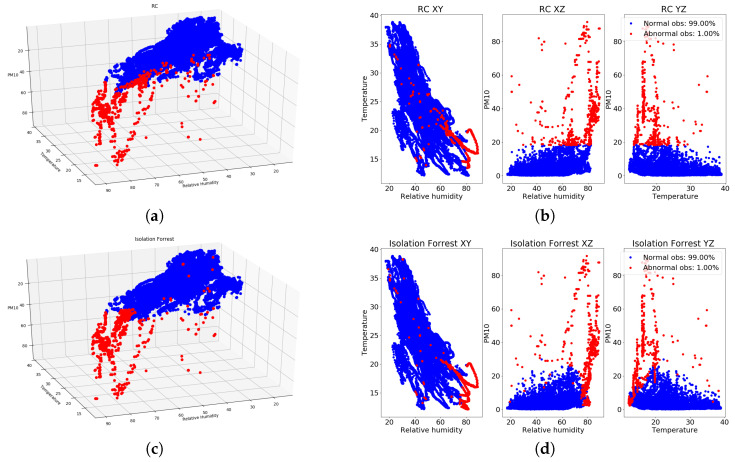
Figure 11.
Outcomes of RC and IF algorithms (blue color: normal samples, red color: abnormal samples) for PM10, temperature and relative humidity values collected by the bpost Car 1. (a) RC with 1.0 (3D perspective), bpost Car 1; (b) RC with 1.0% (3D planes), bpost Car 1; (c) IF with 1.0% (3D perspective), bpost Car 1; (d) IF with 1.0% (3D planes) bpost Car 1.

