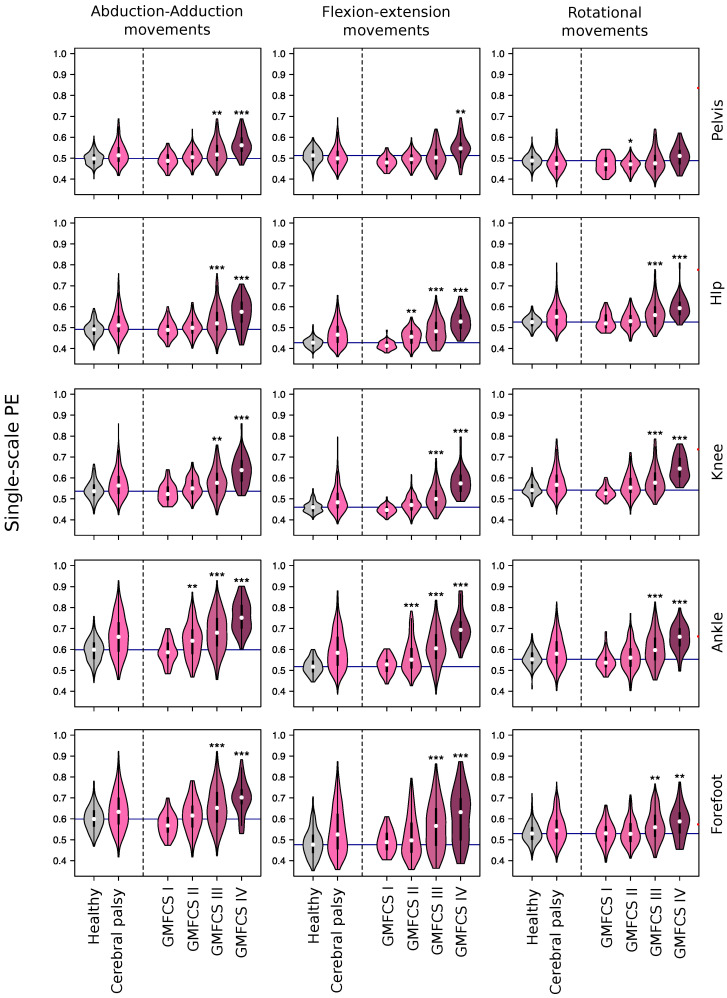
Figure 1.
Probability distributions of the Permutation Entropy (PE), as calculated in control subjects and Cerebral Palsy (CP) patients, the latter including aggregated and disaggregated (w.r.t. the Gross Motor Function Classification System (GMFCS) scale) results. Rows, from top to bottom, respectively correspond to pelvis, hip, knee, ankle and forefoot; columns, from left to right, to the abduction-adduction, sagittal and rotational axes.

