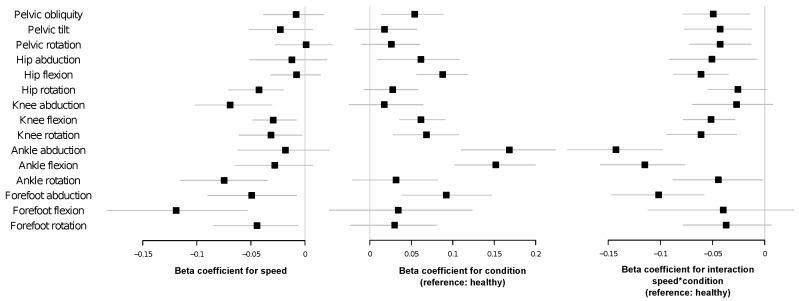
Figure 4.
Forest plots showing the beta coefficients of linear mixed models comparing gait PE values according to normalized walking speed (left panel), condition (using healthy as the reference, central panel) and the interaction of normalized walking speed with condition (right panel). The magnitudes of the effects are indicated on the X axis. Squares represent the mean values of each beta coefficient and horizontal lines the corresponding bias-corrected and accelerated bootstrap intervals. See Section 4.3 for further details.

