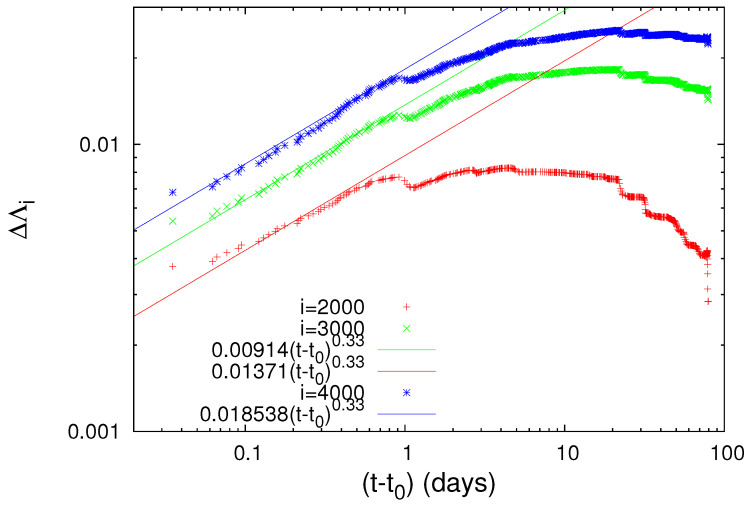
Figure 3.
Log-log plot of the change of the complexity measures (red), (green) and (blue) versus the elapsed time in days since the establishment of scaling behavior after the occurrence of the M7.8 earthquake on 22 December 2010. The value of is approximately 0.2 days measured from the M7.8 earthquake occurrence and .

