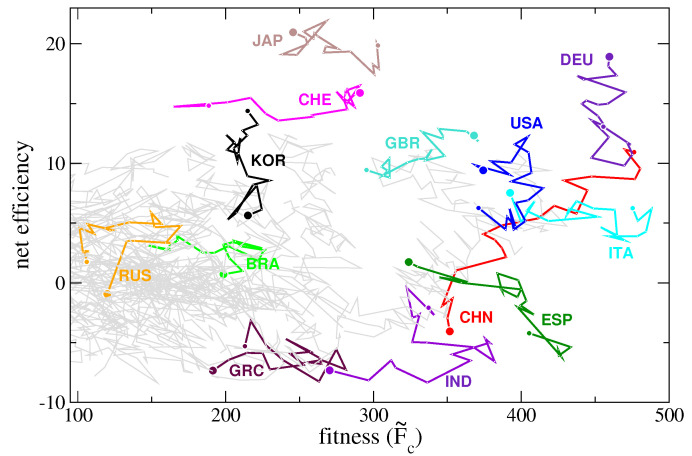
Figure 8.
Net-efficiency vs fitness: each line corresponds to the time evolution of the connection between the fitness of a country and its net-efficiency in the period between 1995 and 2014. This figure connects the quantities on the vertical axes of the plots displayed in Figure 6. Lines start from a large circle (year 1995) and end with a small one (year 2014).

