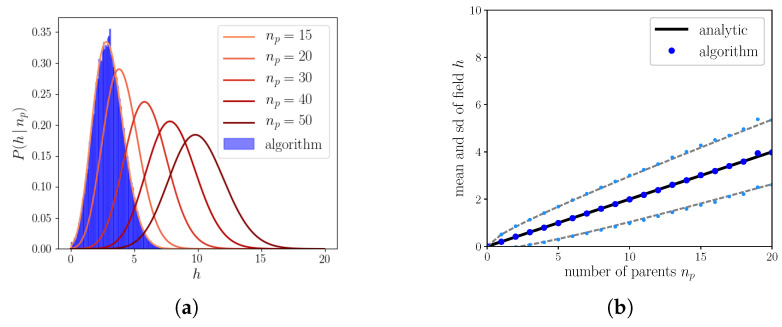
Figure 6.
(a) Solid lines correspond to the analytical distributions of the field, Equation (A8), in blue is the distribution of the fields produced by a simulation of the algorithm for . The parameters are , , , and . (b) The mean and standard deviation of the field as a function of the number of parents.

