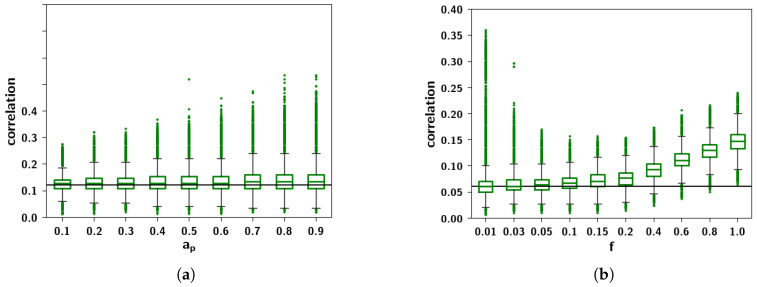
Figure 9.
(a) Boxplots of for different values of , with fixed. (b) Boxplots of for different values of f with fixed. The parameters and f play different roles in generating the correlations. Increasing the extent of the input they receive from each parent increases the overall similarity of those children having shared parents, as evidenced by the increasing skewness of the distributions. In contrast, increasing the prolificity f, leads to an increase in the mean number of shared parents, such that all children are more correlated, as shown by the shift in the overall distribution. The black horizontal line corresponds to the average correlation with uncorrelated patterns distributed according to Equation (1). Other parameters are , and .

