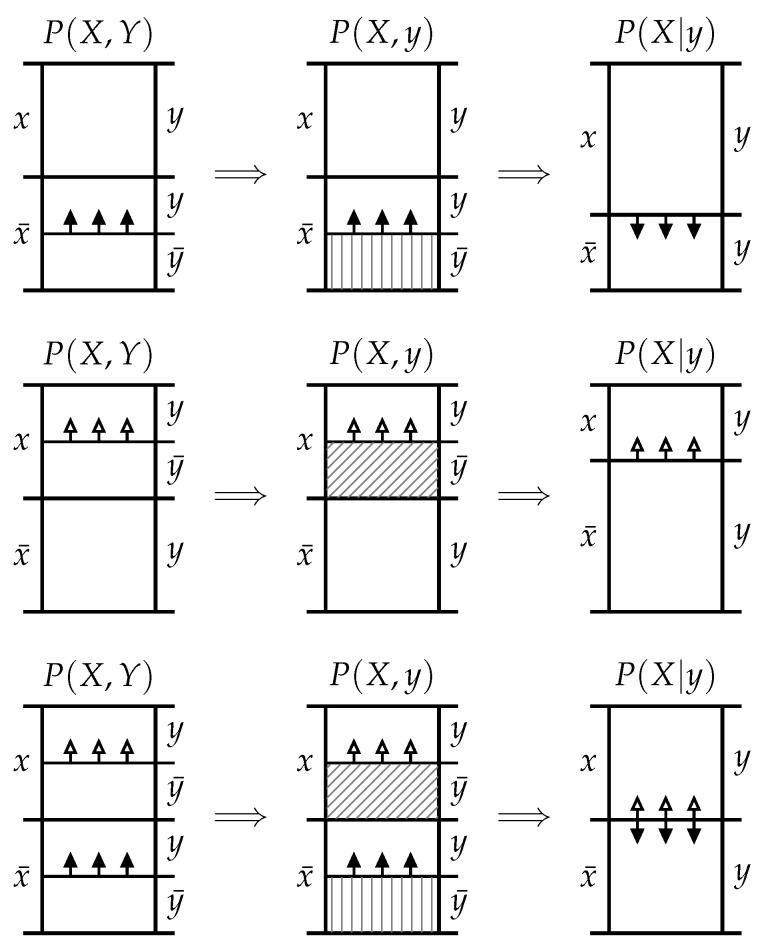
Figure 1.
In probability mass diagrams, height represents the probability mass of each joint event from which must sum to 1. The leftmost of the diagrams depicts the joint distribution , while the central diagrams depict the joint distribution after the occurence of the event leads to exclusion of the probability mass associated with the complementary event . By convention, vertical and diagonal hatching represent informative and misinformative exclusions, respectively. The rightmost diagrams represent the conditional distribution after the remaining probability mass has been normalised. Top row: A purely informative probability mass exclusion, and , leading to and hence . Middle row: A purely misinformative probability mass exclusion, and , leading to and hence . Bottom row: The general case and . Whether turns out to be greater or less than depends on the size of both the informative and misinformative exclusions.

