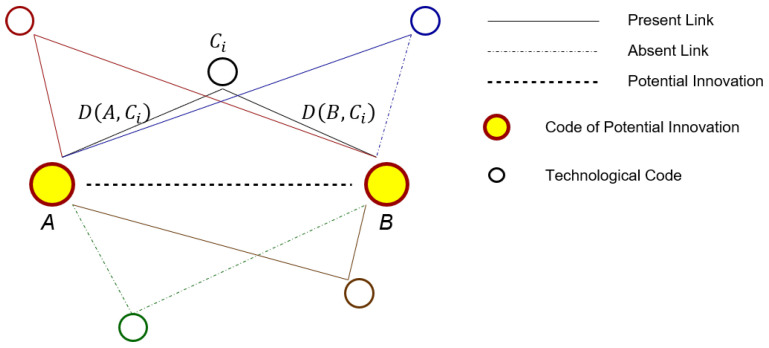
Figure 6.
Country Score. The diagram above illustrates the procedure we use to assign a score to each country for each potential innovation. Such score measures how active is a country in those technological sectors that influence the closeness of the contexts of the potential innovation. The score is defined as the weighted average of all indirect 3-codes-long paths joining the potential innovation.

