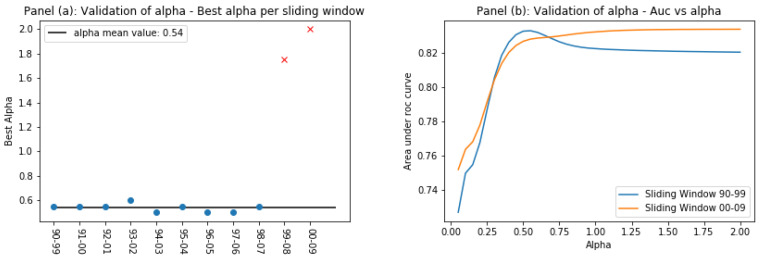
Figure 7.
Tuning of . Panel (a) shows the best in each sliding window, defined as the one yielding the highest area under the ROC curve. Panel (b) shows the curve AUC vs. in two sliding window: the first is 1990–1999 and the last is 2000–2009. In the last window, due to a blurring of technological context, it is not possible to identify the best-performing .

