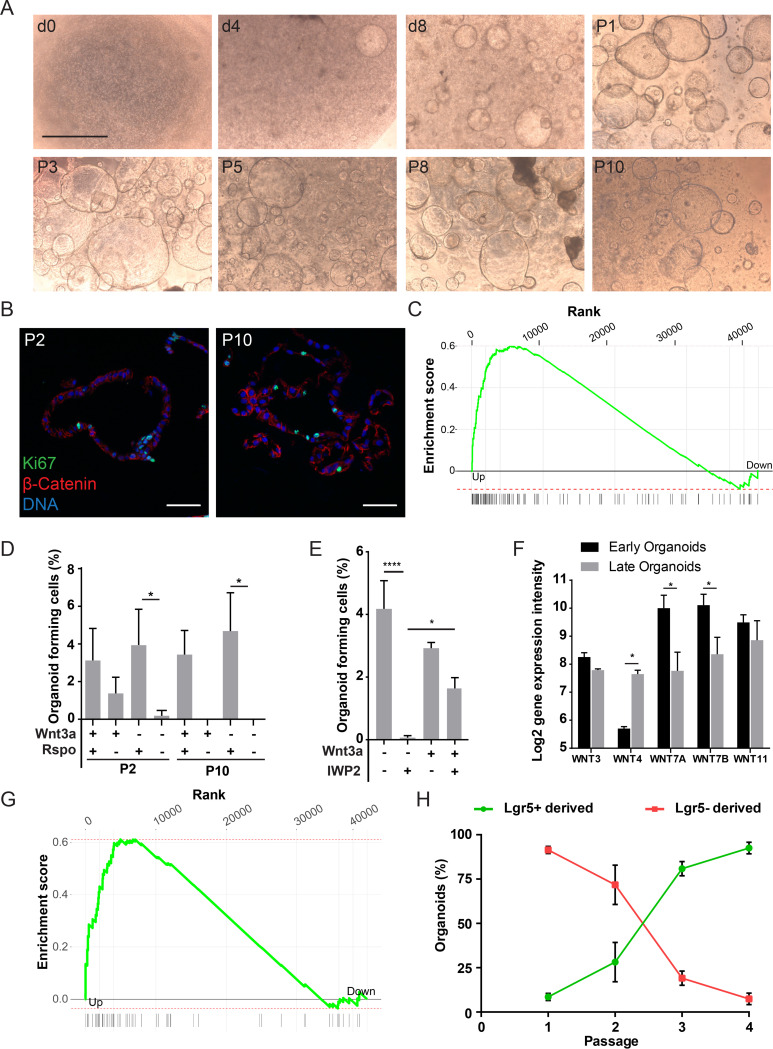
FIG 1.
Cultivation of human gallbladder organoids and dependence on the Wnt/β-catenin pathway activation. (A) Gallbladder epithelial cells were isolated and grown as described in Materials and Methods. Pictures were taken 0, 4, and 8 days after seeding and at passages 1, 3, 5, 8, and 10. Scale bar, 1 mm. (B) Gallbladder organoids were fixed 7 days after seeding. Organoids were paraffinized, sectioned, and immunostained for the proliferation marker Ki67 (green), β-catenin (red). DRAQ5 was used to stain the nuclei (blue). (C) Gene set enrichment analysis of human pluripotent stem cell genes published by Mallon et al. (42) among genes regulated in early versus late organoids, as identified by microarray. Adjusted P value = 0.00039, enrichment score = 0.6, normalized enrichment score = 1.9. (D) Organoids at passage 1 were split to single cells and seeded, and the number of resulting organoids was counted 5 to 7 days later (i.e., at passage 2), in media + or − Wnt3A and + or − Rspo1. The organoids were kept in culture and the procedure was repeated after 8 passages (i.e., at passage 10). *, P < 0.05 (t test). (E) Organoids were split to single cells which were seeded in Matrigel and provided with media + or − the Wnt inhibitor IWP-2 and + or − 25% of Wnt3a conditioned medium. The number of resulting organoids was counted 5 to 7 days later. *, P < 0.05; ****, P < 0.00005. (F) Change in expression levels of Wnt family members observed in a microarray comparing early versus late organoids. Only transcripts with an average log2 expression of >6 are shown. *, P < 0.05 (t test). (G) Gene set enrichment analysis of β-catenin targets published by Herbst et al. (44) among genes regulated in early versus late organoids as identified by microarray. Adjusted P value = 0.0015, enrichment score = 0.61, normalized enrichment score = 1.8. (H) Lineage tracing of murine organoids derived from the Lgr5 reporter mouse, Lgr5-EGFP-IRES-CreERT2, ROSA-mTmGfloxed after HT induction. The number of organoids derived from Lgr5+ cells (green) and Lgr5– cells (red) was counted at each passage 5 to 7 days after seeding. The plot shows the percentage of each population compared to the total number of organoids. Bars indicate the standard deviations (SD).

