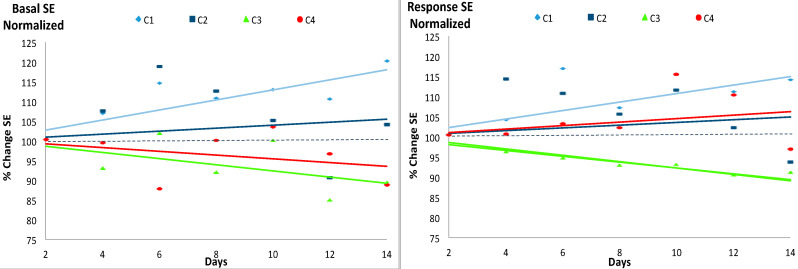
Figure 3.
Evolution of the normalized Shannon Entropy (SE) values for the basal state (left) and the response to the event (right) during the 14 experimental days. The four experimental groups (C1, C2, C3 and C4) with 7 individuals each are described in Table 1. Absolute values of the SE are shown in Table 3. The solid lines represent the linear trend of SE from the initial condition at the beginning of the experimental period (normalized SE = 100). For each case, the color of the line is the same as the color of the marker. See Table 4 and Table 5 for further information.

