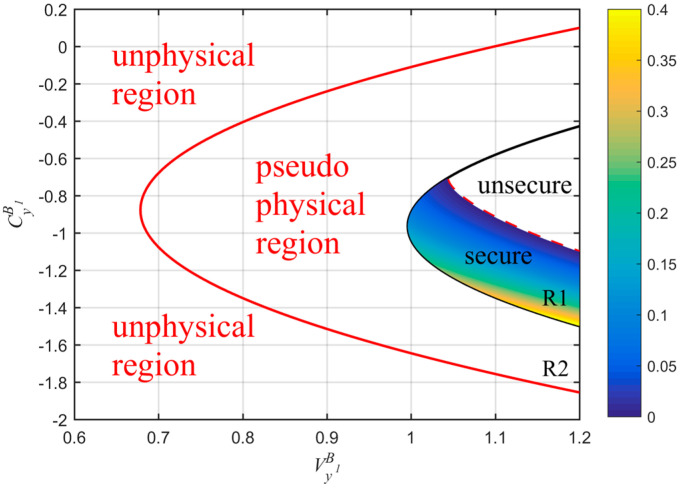
Figure 4.
Comparison among physical regions of the UD protocol under both ideal and realistic detection conditions. The red solid line represents the realistic parabolic curve (equivalent to Bob using a realistic homodyne detector with ) and black solid line is the ideal parabolic curve (equivalent to Bob using an ideal homodyne detector with ). The red dashed line represents the part where the key rate is zero under realistic detection condition. Here, we set: , (corresponding to a distance of 20 km fiber), and .

