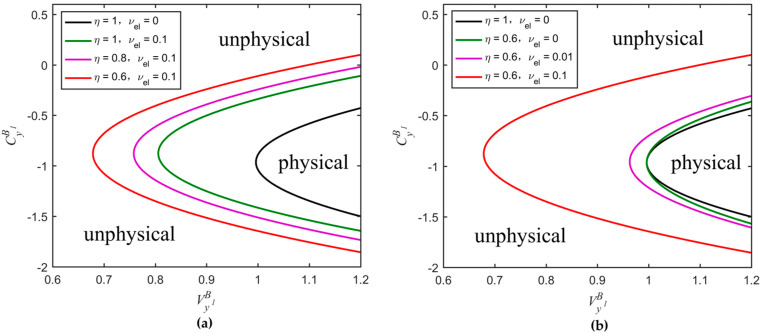
Figure 5.
Comparison among physical regions delimited by the parabolic curves of the UD protocol. The black solid curve corresponds to the ideal parabolic curve, whereas the others to the realistic parabolic curves obtained for different parameter conditions. (a) Changes of the physical region extension according to different values of ( remains constant); (b) Changes of the physical region extension according to different values of ( remains constant). The values of the parameters , , and are the same as in Figure 4.

