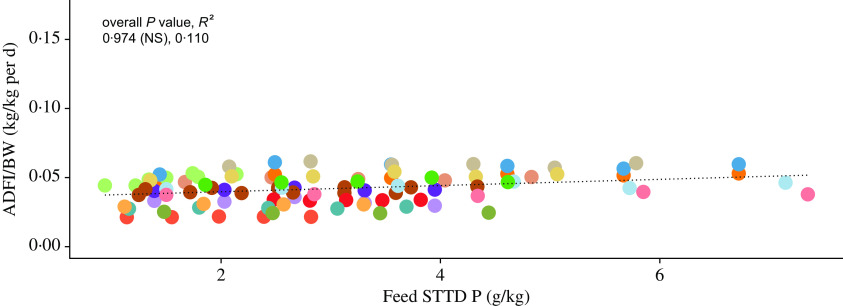
Fig. 2.
Body weight (BW)-scaled average daily feed intake (ADFI/BW; kg/kg per d) against feed standardised total tract digestible (STTD) phosphorus content (g/kg): individual data points (n 97) represent mean values for each considered dietary treatment reported in fifteen studies (see online Supplementary material for a list of included studies). The dotted line represents the overall predicted effect of feed STTD phosphorus content on the scaled ADFI. Probability (P) and coefficient of determination (R2) values are given for the overall fit and for fit within the included experiments. * P < 0·05; ** P < 0·01; *** P < 0·001. Data: first author, year (P, R2):  , Alebrante, 2011 (0·179 (NS), 0·248);
  , Arouca, 2012a (0·464 (NS), −0·074);
  , Arouca, 2012b (0·319 (NS), 0·095);
  , Baker, 2013 (0·007 (**), 0·751);
  , Bunzen, 2012 (0·261 (NS), 0·185);
  , Campos, 2012 (0·444 (NS), −0·035);
  , Carter, 1998 (0·542 (NS), 0·153);
  , Hastad, 2004a (0·894 (NS), −0·324);
  , Hastad, 2004b (0·241 (NS), 0·220);
  , Mavromichalis, 1999 (0·362 (NS), 0·110);
  , Saraiva, 2009 (0·130 (NS), 0·343);
  , Saraiva, 2011 (0·361 (NS), 0·038);
  , Saraiva, 2012a (0·340 (NS), 0·065);
  , Saraiva, 2012b (0·678 (NS), −0·246);
  , Zhai, 2013a (0·971 (NS), −0·250);
  , Zhai, 2013b (0·175 (NS), 0·254);
  , Zhai, 2013c (0·183 (NS), 0·087).

