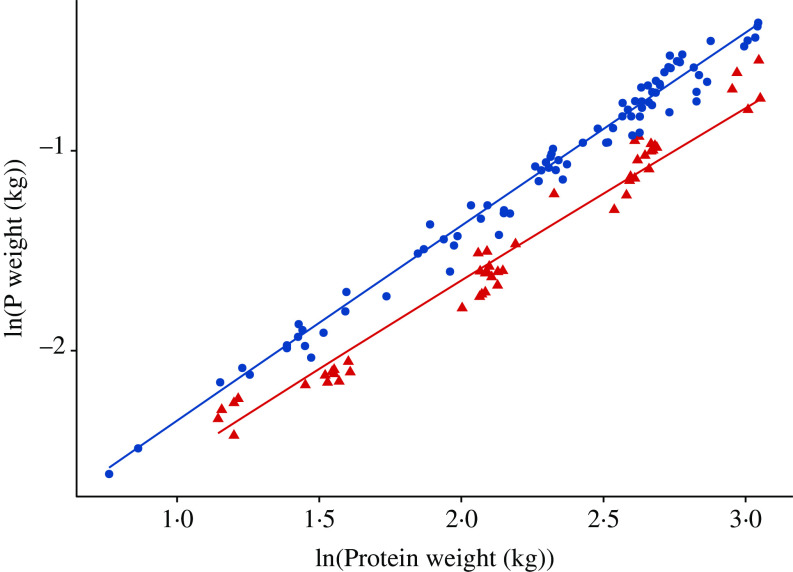
Fig. 3.
Relationship between body phosphorus weight and body protein at the time of slaughter weights in growing and finishing pigs; individual data points (n 136) represent mean values for each considered dietary treatment reported in eleven studies (see online Supplementary material for a list of included studies). The data were expressed on the natural logarithmic (ln) scale, under the following two ad libitum feeding schedules: (1) pigs were given nutritionally balanced feeds; (2) pigs were given phosphorus-deficient feeds. Data:  , balanced feed;
  , phosphorus-deficient feed.

