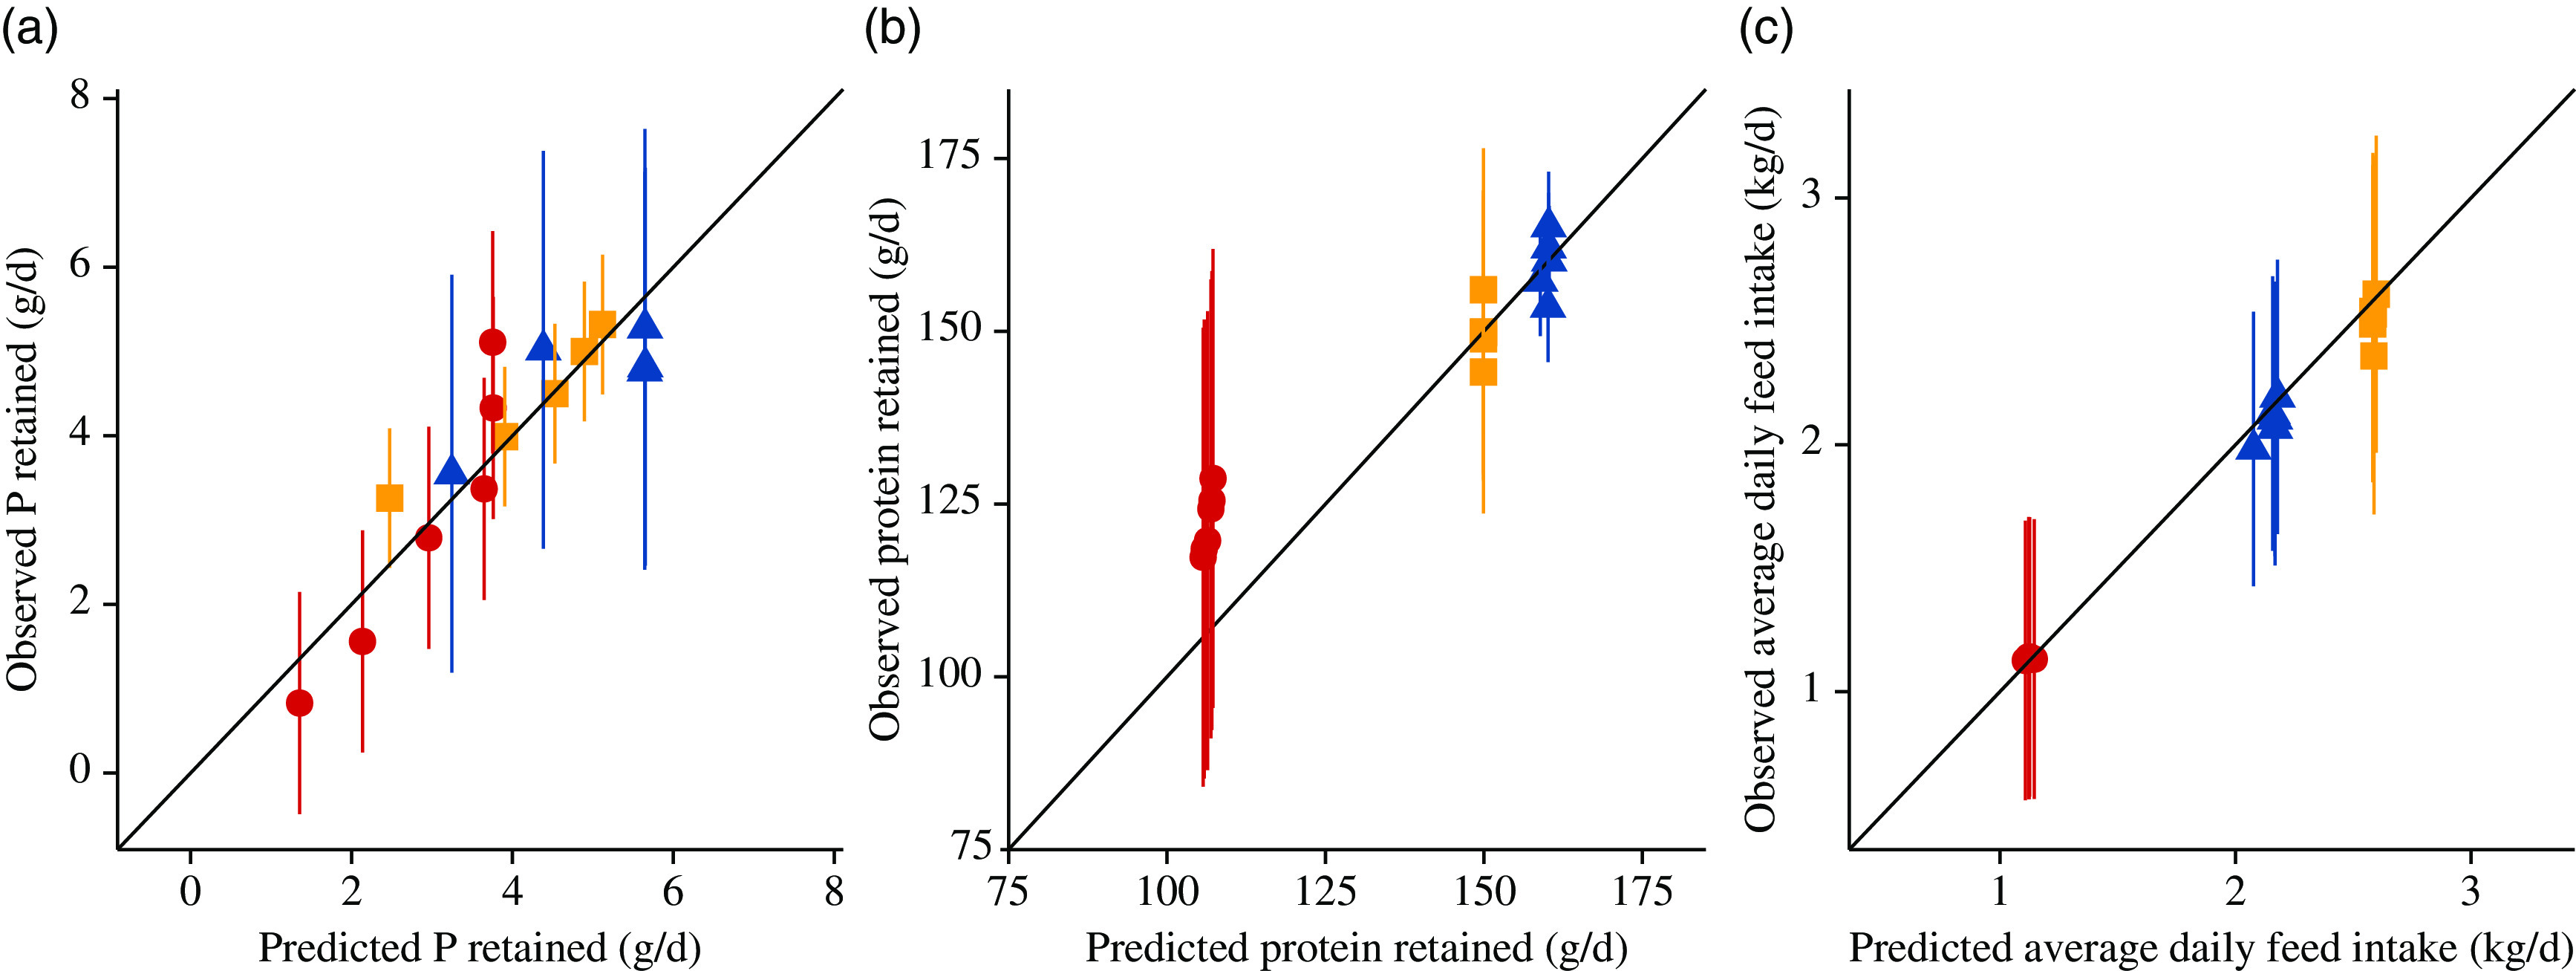
Fig. 9.

Pooled model validation: observed v. fitted values (generated by a mechanistic model). for: (a) daily phosphorus retention (g/d); (b) daily protein retention (g/d); (c) average daily feed intake (kg/d). Data originated (n 16) from the following three papers: (1)  , Adeola et al.(78); (2)
  , Pomar et al.(77) and (3)
  , Ekpe et al.(76). Values are represented as means and 2 sd.
