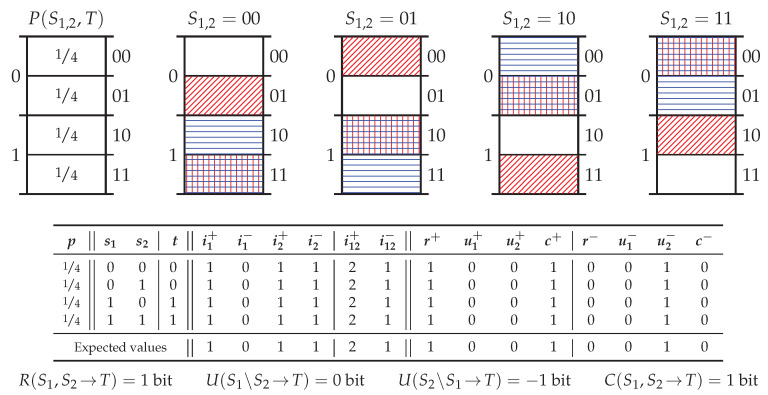
Figure A2.
Example Unq. (Top) the probability mass diagrams for every single possible realisation; (Middle) for each realisation, the PPID using specificity and ambiguity is evaluated (see Figure 4); (Bottom) the atoms of (average) partial infromation obtained through recombination of the averages.

