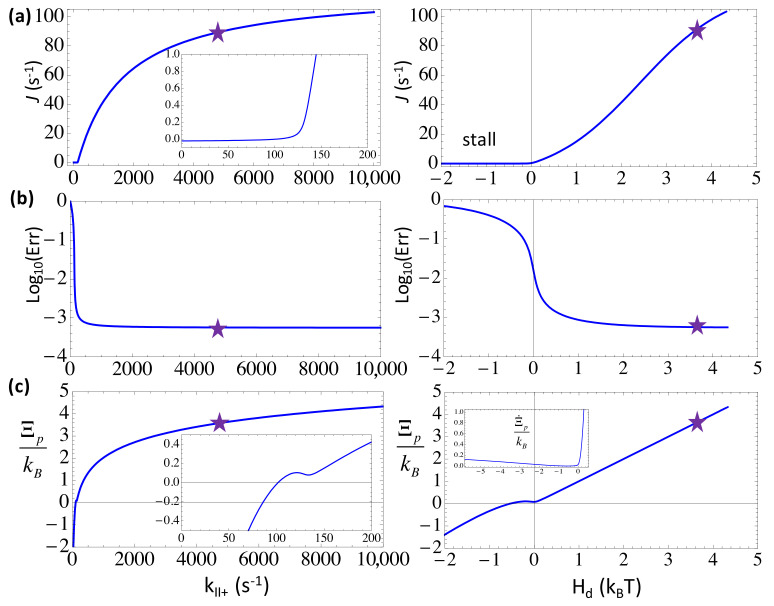
Figure 3.
The elongation characteristics upon varying the substrate binding rate kII+ in the three-state scheme. The elongation rate J (a); the error rate Err in the logarithmic value (b); and the entropy production per cycle (c) are shown versus kII+ (left) or versus the free energy expenditure Hd (right). The corresponding characteristic values at the default value of kII+ = 4.7 × 10³ s−1 ([NTP] = 588 uM) are labeled by stars. Note that the entropy production rate is also shown in the inset of (c) right.

