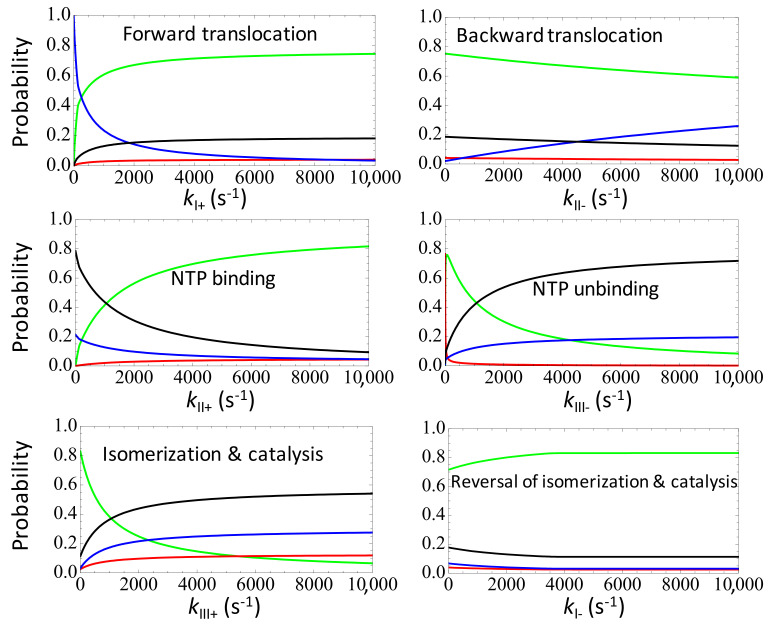
Figure 6.
The non-equilibrium steady state (NESS) probability distributions upon varying individual rates in the three-state model of NAC with selection. The probabilities of the state I, II, IIIr and IIIw are shown in blue, black, green, and red curves. The left column shows the state population or probability changes upon the forward rate changes, while the right column shows that upon the backward rate changes.

