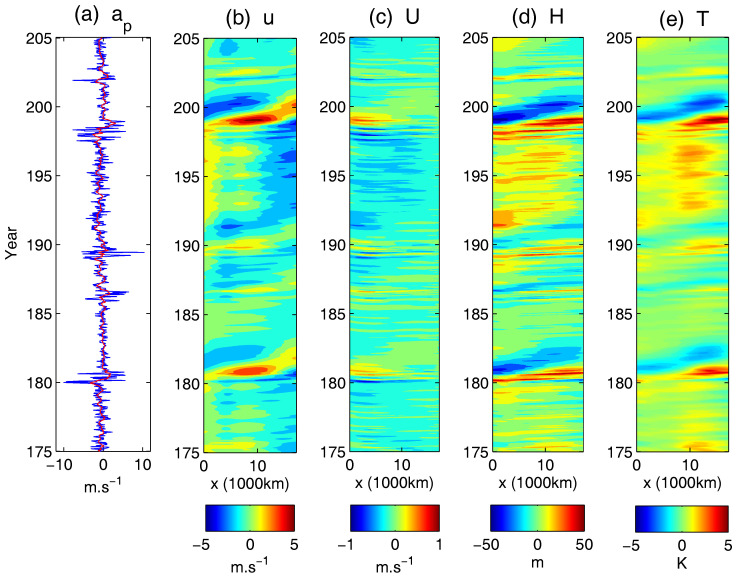
Figure 17.
Model simulations of the coupled ENSO model (104)–(108). The x-axis is the zonal region of the equatorial Pacific. The y-axis is time. (a) time series of the stochastic wind burst amplitude (blue) and its 90-day running mean; (b–e) atmosphere wind u, ocean current U, thermocline depth H and SST T.

