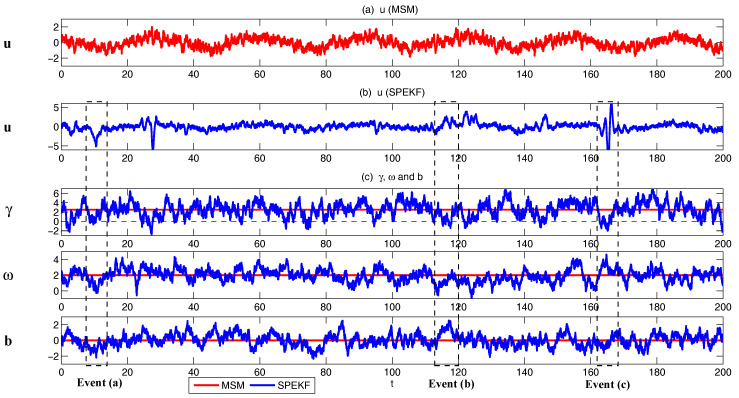
Figure 18.
Simulations of the SPEKF model and MSM. (a) the observed variable u from MSM (120); (b) the observed variable u from SPEKF model; (c) hidden variables. The parameters are given in (121). The red curves are for MSM and blue ones are for SPEKF. The black dashed line in the process indicates the threshold of zero. When is below this threshold, becomes anti-damping and the associated signal of u tends to have exponential growth.

