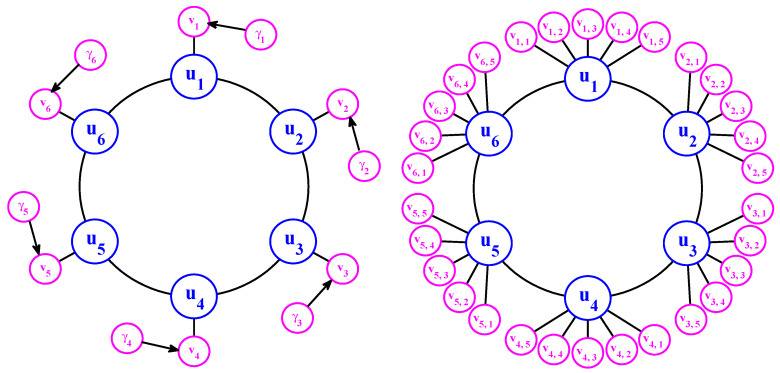
Figure 19.
Schematic illustration of the coupling between different variables in the stochastically coupled FHN model (135) (left) and the two-layer L-96 model (136) (right). For illustration purposes, is used in this figure while and in the model simulations. All the variables are coupled to each other with no trivial decoupling.

