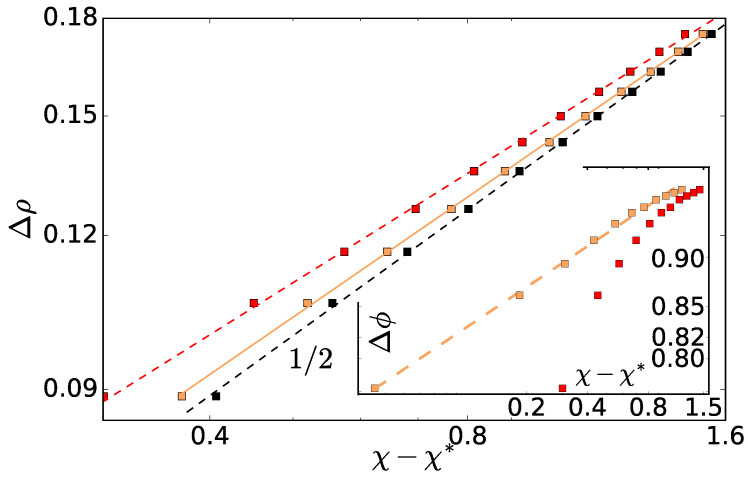
Figure 6.
Density difference as a function of temperature asymmetry in log–log scale. Fits of are shown when (i) (orange) all three parameters A, and are fitted (values , and , respectively), (ii) only A and are fitted (, ), while is set to (black) and (iii) only A and are fitted (, ) while is set to (red). Note that the x-axis includes , which is different for the different fits, and, therefore, the data points look like three different sets. Inset: Difference in volume fraction of the hot particles as a function of the temperature asymmetry . Different curves correspond to different fitting procedures: (i) all three parameters are fitted , , (orange), (ii) was set to , but the curve does not exhibit a power law behavior (red). Similarly, the data are not consistent with a power law with exponent (not shown).

