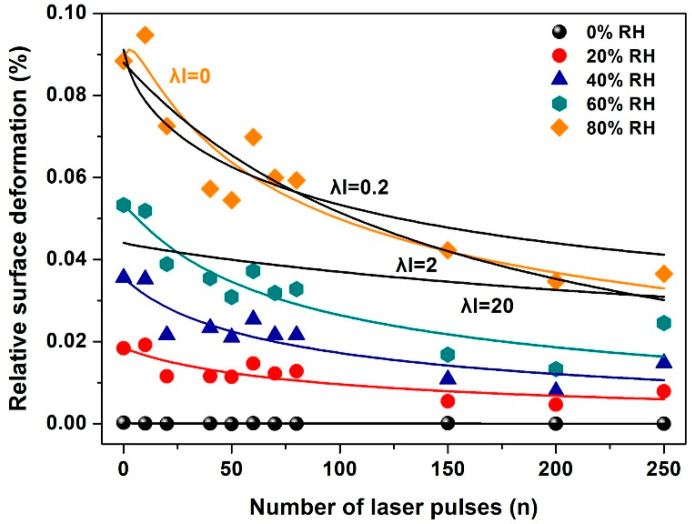
Figure 10.
The relative strain of ~345 nm PHEMA thin layers at different irradiating conditions and relative humidity (RH) measured with White Light Reflectance Spectroscopy (WLRS). The black lines at 80% RH are fittings for λl values of 0, 0.2, 2 and 20, respectively, suggesting a small contribution (λl = 0, 0.2) from electric dipole attachment of water molecules to binding polar sites in the PHEMA matrix.

