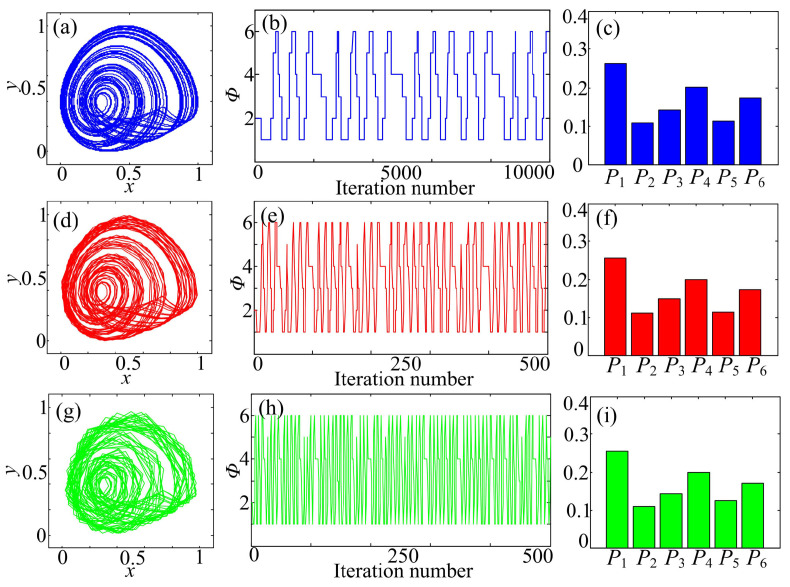
Figure 10.
States of System (15) under different scale factors. (a) Phase diagram under ; (b) quantification pattern series under ; (c) probability distribution under ; (d) phase diagram under ; (e) quantification pattern series under ; (f) probability distribution under ; (g) phase diagram under ; (h) quantification pattern series under ; (i) probability distribution under .

