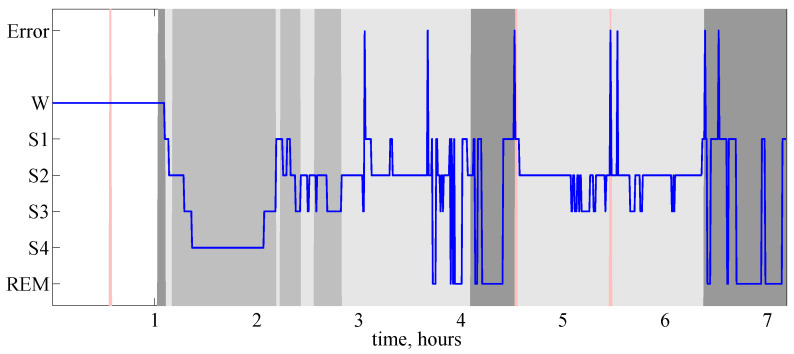
Figure 3.
Hypnogram (bold curve) and the results of ordinal-patterns-based discrimination of sleep EEG. Here, the y-axis represents the results of the expert classification: W stands for waking, stages S1, S2 and S3, S4 indicate light and deep sleep, respectively, REM stands for REM sleep and Error—for unclassified samples. Results of ordinal-patterns-based discrimination are represented by the background colour: white colour indicates epochs classified as waking state, light gray—as light sleep, gray—as deep sleep, dark gray—as REM, red colour indicates unclassified segments

