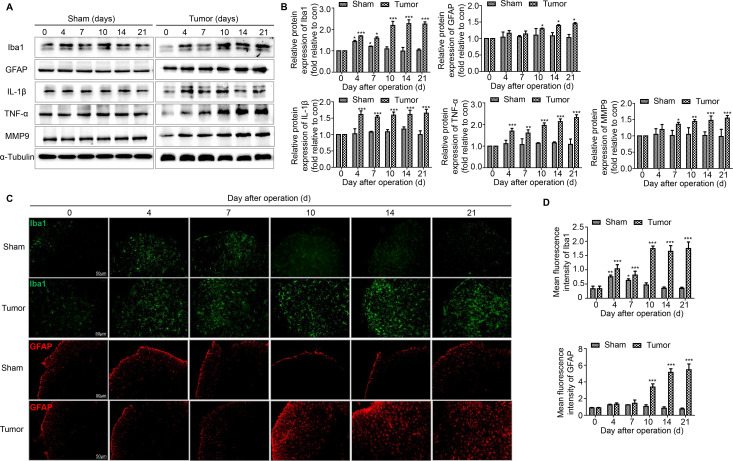
Figure 3.
The activation of microglia and astrocytes and the expression of proinflammatory cytokines related to the disruption of BSCB in the spinal cord over time. (A, B) Representative blots and quantification of Iba1, GFAP, IL-1β, TNF-α and MMP9 on postoperative days in the sham and tumor groups. n=3 for each time point per group. (C, D) Immunofluorescent staining and quantification of mean fluorescence intensity of Iba1 (green) and GFAP (red) in the ipsilateral spinal cord dorsal horn of the sham and tumor group of mice over time. Scale bar, 50 µm. n=3 for each time point per group. *P<0.05 vs day 0, **p<0.01, ***p<0.001. All data are presented as the means±SD. BSCB, blood–spinal cord barrier; GFAP, a marker of astrocyte; Iba1, a marker of microglia; IL-1β, interleukin-1β; TNF-α, tumor necrosis factor α.

