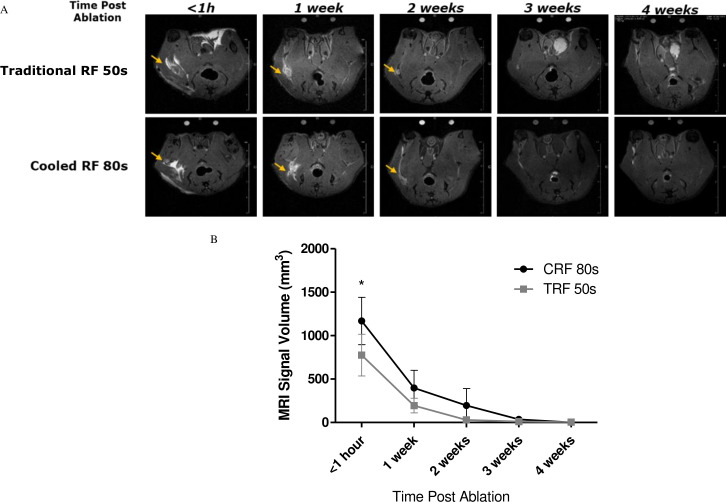
Figure 4.
Distinct lesion zones (‘white zones’ indicated by yellow arrows in <1-hour panels) detectable for up to 2 weeks postablation in cooled RF treatment group. (A) Representative images depict axial, T2-weighted MR scans, acquired from a 9.4T Bruker scanner. (n=4–6 per group per time point) (B) Quantified volumes of signal hyperintensity surrounding the lesion site at various time points using the mimics software (bars represent mean±SD, n=4–6 per group per time point; *p<0.05). RF, radiofrequency.

