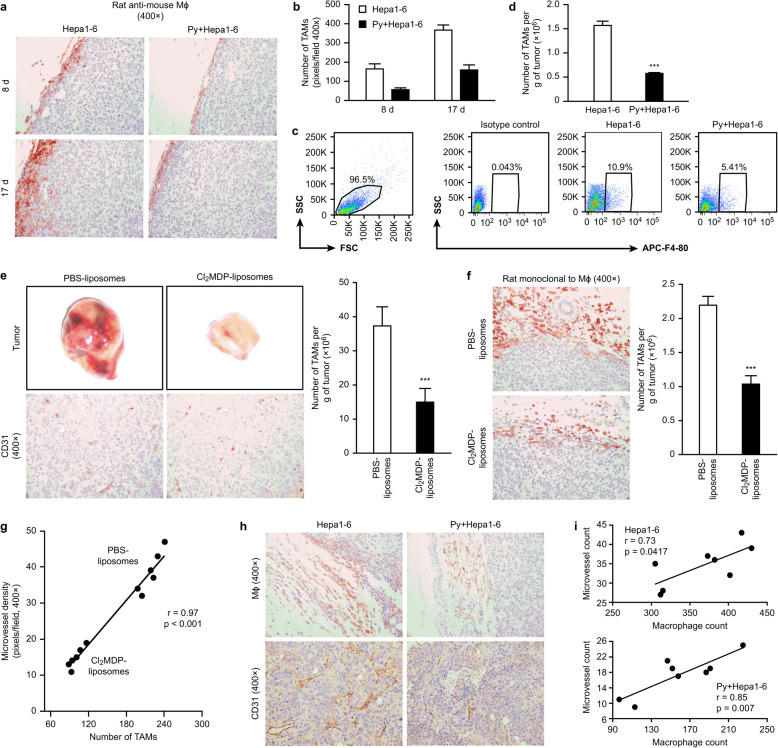
Fig. 3.
Quantification of TAM infiltration into tumor tissue. a-b Tumor histological specimens were prepared on days 8 and 17 after infection with Plasmodium parasites (n = 4) and stained immunohistochemically with a “rat mAb against mouse macrophages” (clone No. RM0029-11H3) (colored by AEC). Representative images are presented (a). The number of infiltrating TAMs was quantified by counting (b). ***, p < 0.001. c-d The infiltrating TAMs were sorted by FACS using a FITC-conjugated anti-F4/80 mAb. The proportion of TAMs was analyzed (c). The absolute number of TAMs was quantified per gram of tumor (n = 5) (d). All the data were analyzed using FlowJo software (7.6.1 version). The purity of the cell populations was between 85 and 90%. e-f Hepa1–6 tumor-bearing mice were treated with Cl2MDP liposomes at the scheduled time point. The tumor tissues were dissected after the mice were sacrificed, and tumor angiogenesis was examined visually and imaged (e, upper panel). PBS liposomes were used as a control. Neovascularization was examined by immunohistochemical staining with antibodies reactive to CD31, and representative images are shown (e, bottom panel). The infiltrating TAMs were stained with a rat mAb that recognizes mouse macrophages [RM0029-11H3] and imaged (f, left panel). Original magnification: 400×. Quantitative analyses of the MVD (e right panel) and TAMs (f, right panel) were performed. The data are presented as the mean numbers of MΦ/MVD per field ± SDs (10 fields per tumor sample, six tumors per group, 400× magnification, 0.17 mm2/field). ***, p < 0.001. g The correlation between TAM infiltration and MVD in tumor-bearing mice treated with Cl2MDP liposomes or PBS liposomes was analyzed by Pearson’s correlation analysis. h-i Histological tumor specimens were prepared on day 17 after infection with Plasmodium parasites (n = 4) and stained immunohistochemically with a “rat mAb against mouse macrophages” and an antibody reactive to CD31. Representative images are shown (h). Original magnification: 400×. The number of infiltrating TAMs and the MVD were quantified by counting. The data are presented the numbers per field ± SDs (10 fields per tumor sample, eight tumors per group, 400× magnification, 0.17 mm2/field). The correlation between TAM infiltration and the MVD was analyzed by Pearson’s correlation analyses (i)

