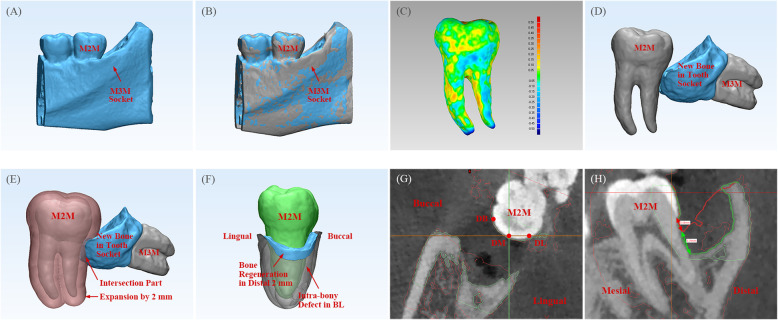
Fig. 1.
Construction and measurement using the digital model. a Construction of a digital model of an extraction socket. b Registration of a model of an extraction socket at different times (BL model in gray, Po.6 m model in blue). c 3D color map of the geometric deviation of the M2M at different times: the deviation range was set between −0.5 mm and 0.5 mm. The map started with blue (negative-error area), then passed through green (near no-error area), and ended with red (positive-error area). d Volume of total bone regenerated in a tooth socket (blue model). e Border of the M2M was expanded by 2 mm (transparent pink). Bone regeneration in the distal 2 mm of the M2M was determined as the interaction part of bone regenerated in the tooth socket (blue model) and expanded 2 mm of the M2M (transparent pink). f The DBD of the M2M at BL (transparent gray) and bone regeneration in the distal 2 mm of the M2M (blue model) could be observed visually. g Selection of DB, DM and DL sites of the M2M. h Measurement of the DBD depth of the M2M. Extraction-socket model at BL (bone margin is described as a green line) and Po.6 m (bone margin is described as a red line) was registered. The DBD depth at Po.6 m (red arrow) and reduction in the DBD depth (green arrow) was assessed, respectively. DBD = distal intra-bony defect

