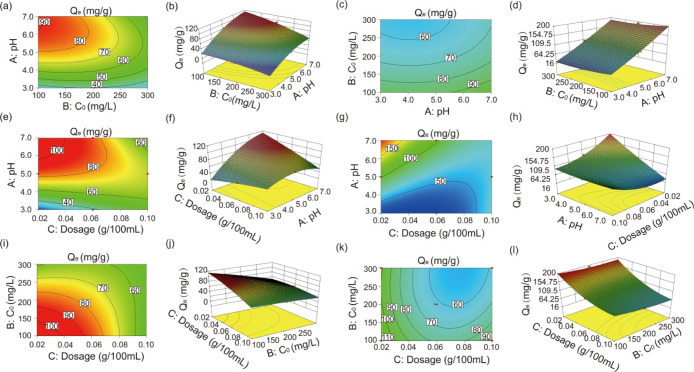
Figure 5.
Response 3D surface and contour plot between each factor (A = pH, B = initial concentration, C = dosage) and response (the Co2+ adsorption capacity): response 3D surface and contour plot between A and B of Na-SGM(a,b) and K-SGM (c,d), A and C of Na-SGM (e,f) and K-SGM (g,h), B and C of Na-SGM (i,j) and K-SGM (k,l).

