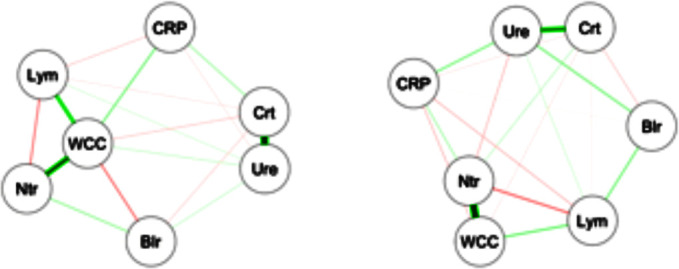
Figure 1.

Partial correlations between biomarkers. Nodes represent average marker levels from day 2 to day5 and edges represent partial correlations, as calculated from the survivors (left) and from the decedents (right). Broader lines indicate stronger relationships. Blr, bilirubin, CRP, C reactive protein, Crt, creatinine, Lym, lymphocytes, Ntr, neutrophils, WCC, white cell count, Ure, urea.
