
Figure 3.
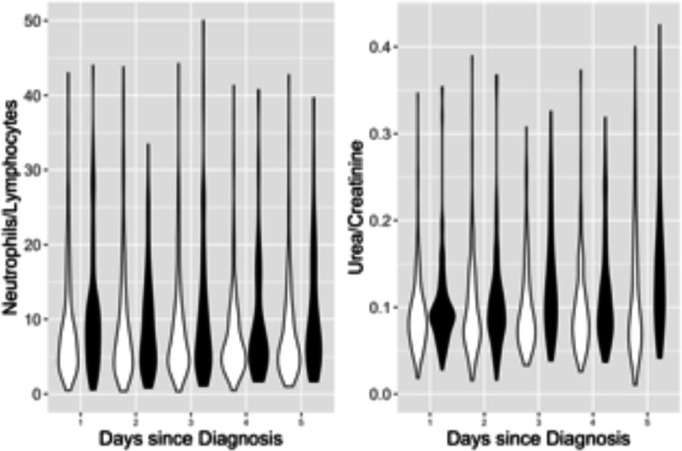
Violin plots showing distribution at each day of admission, stratified by survival status, for biomarkers identified by statistical modelling. Panel A: log-transformed neutrophil (×109/L)/lymphocyte (×109/L) ratio. Panel B: log-transformed urea (mmol/L)/creatinine (μmol/L) ratio. Survivors (white) on left and decedents (shaded) on right.