Figure 4.

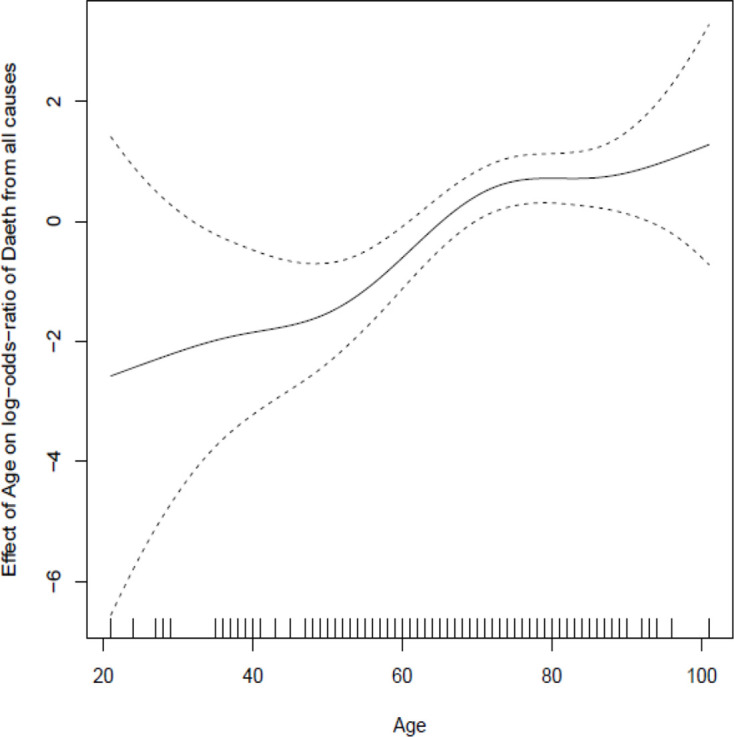
Spline plot demonstrating marked non-linearity in relationship between age and outcome after adjustment for other factors included in the final model.

Spline plot demonstrating marked non-linearity in relationship between age and outcome after adjustment for other factors included in the final model.