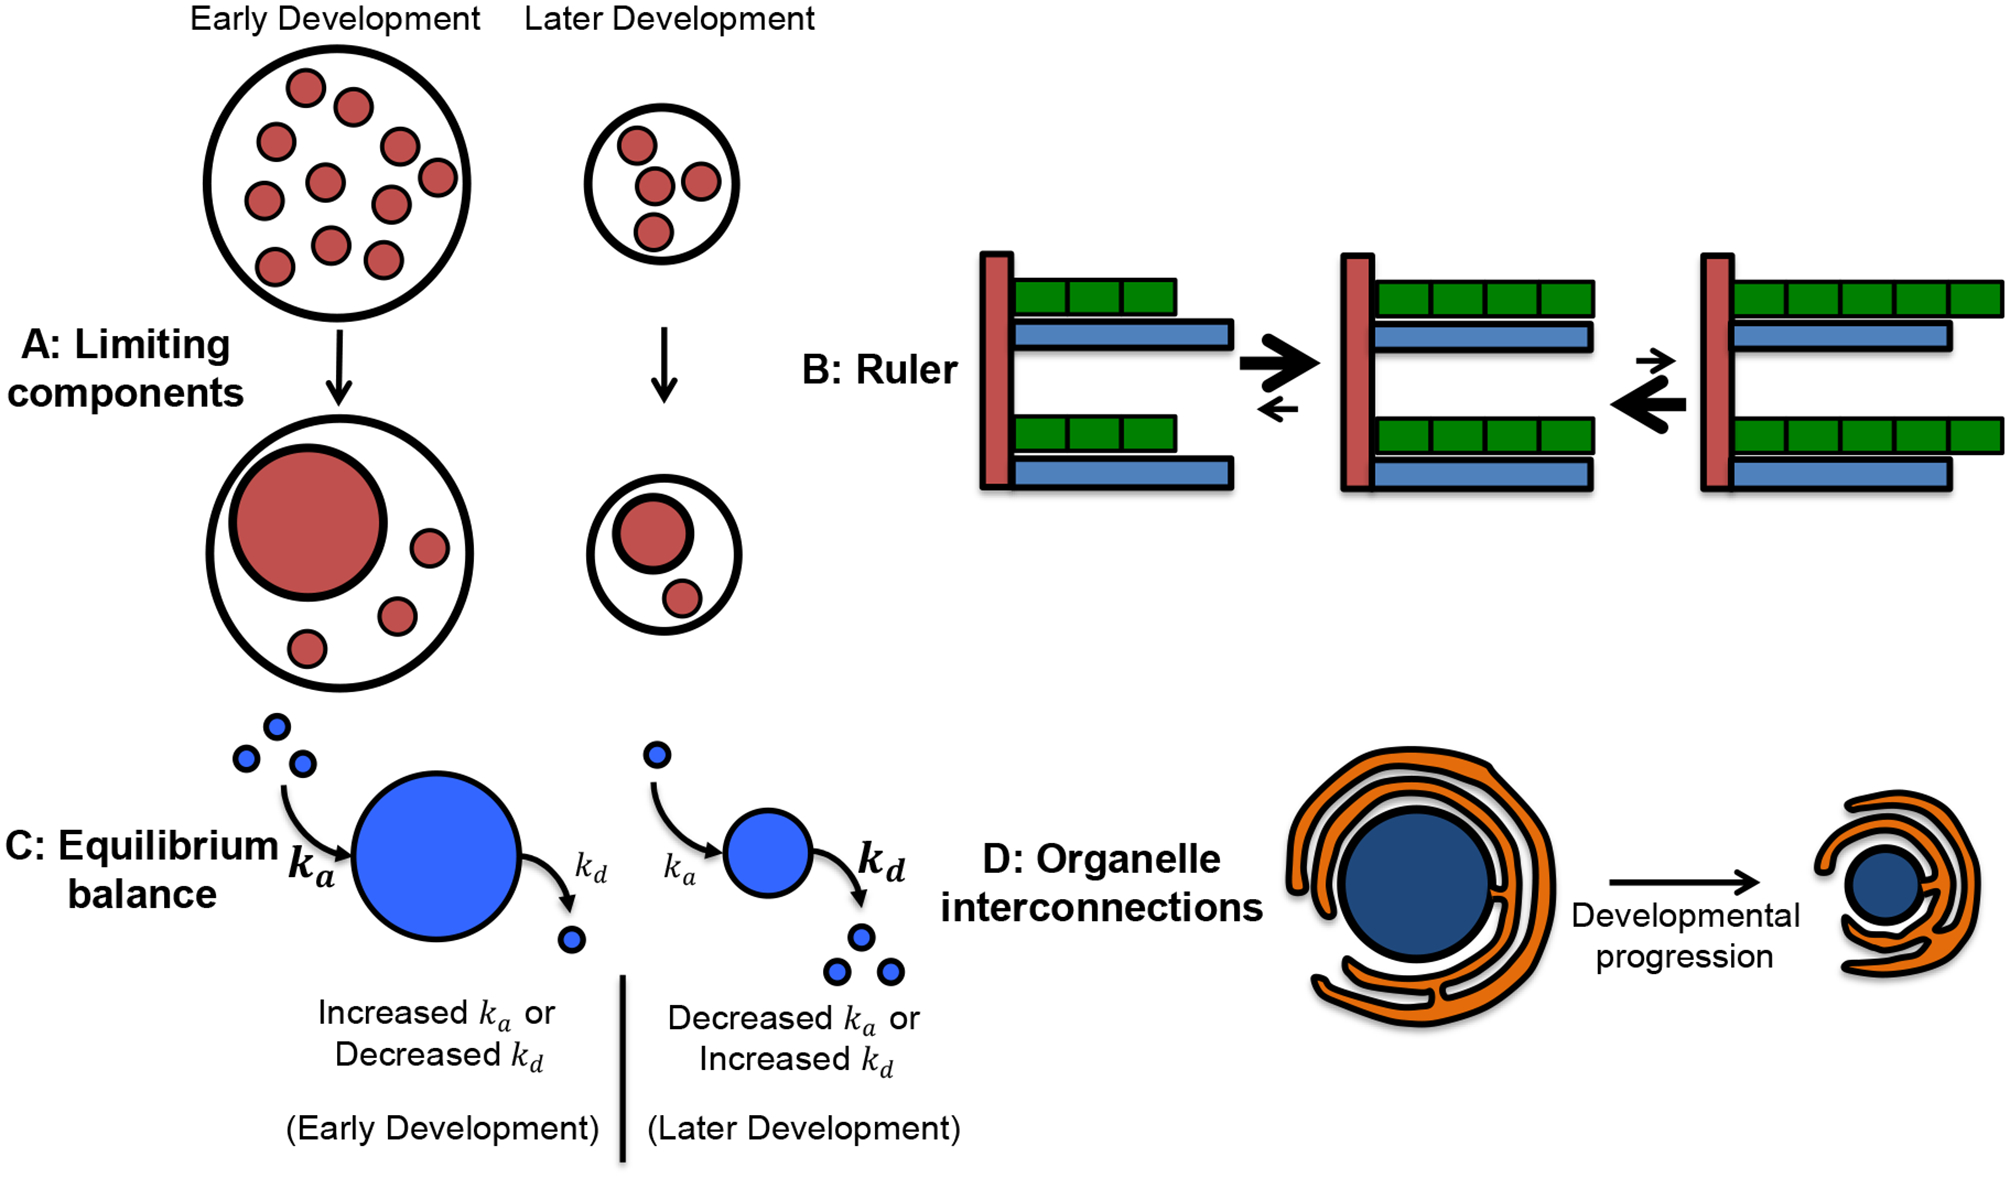
Figure 2: Models for developmental organelle size scaling.

(A) Small red circles represent components that limit assembly and/or growth of the larger red organelle. Over development, limiting components are partitioned into greater numbers of smaller cells, such that the absolute amounts of limiting components per cell decrease leading to smaller organelle size. (B) Green rectangles assemble to form a linear structure whose length is dictated by the blue ruler. Developmental changes in the size of the ruler or building blocks might lead to reductions in the overall size of the structure. (C) A balance of assembly and disassembly sets steady-state organelle size. Developmental changes in assembly and disassembly rates would lead to organelle size scaling. (D) The orange and blue organelles are connected through membranes. Developmental reductions in the size of one organelle might lead to concomitant size scaling of the interconnected organelle. Another possible scenario is that total membrane amount remains constant but membrane distribution changes such that one organelle increases in size and the other becomes smaller.
