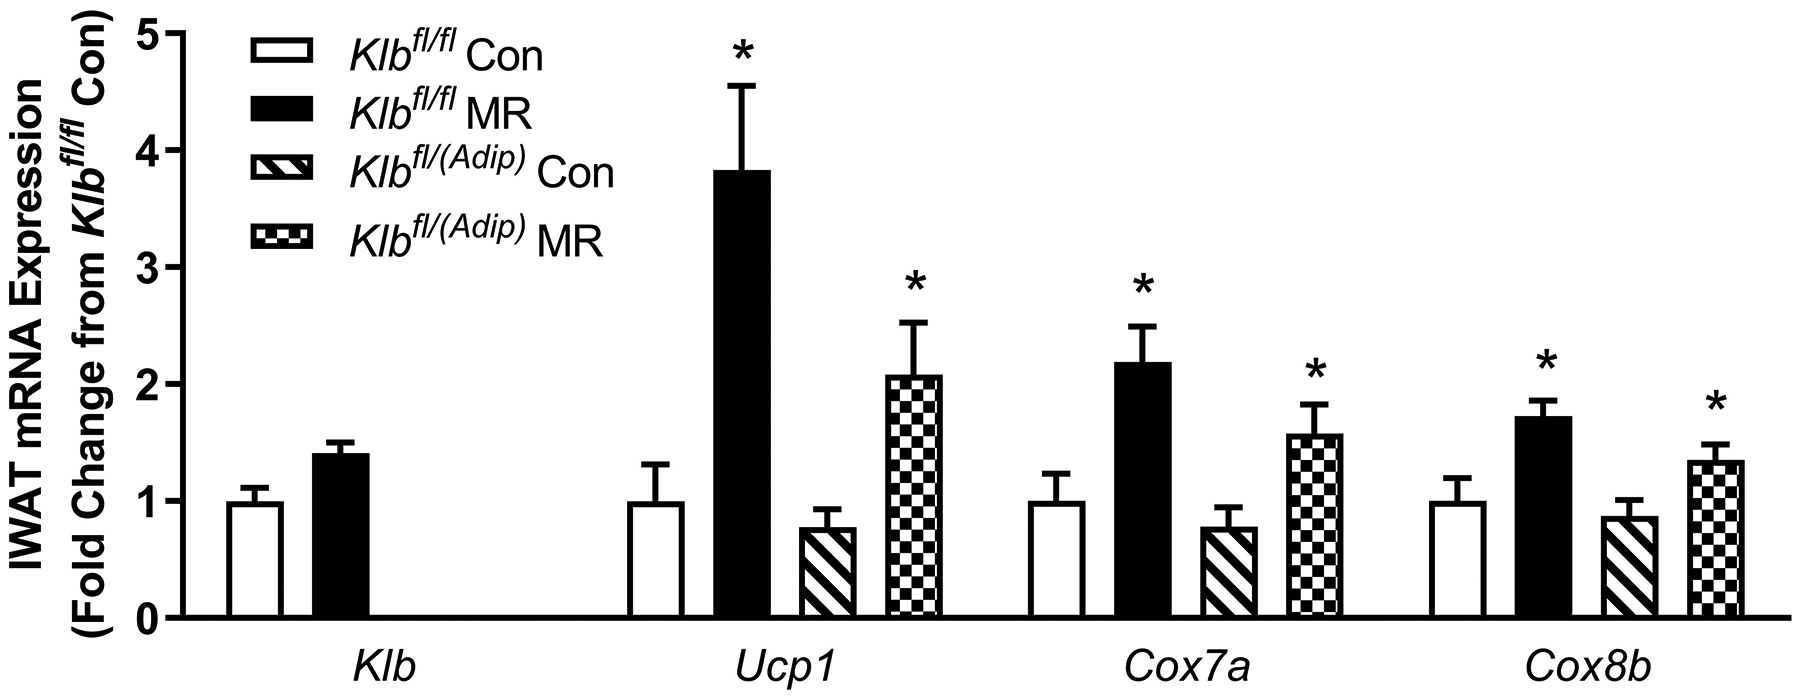
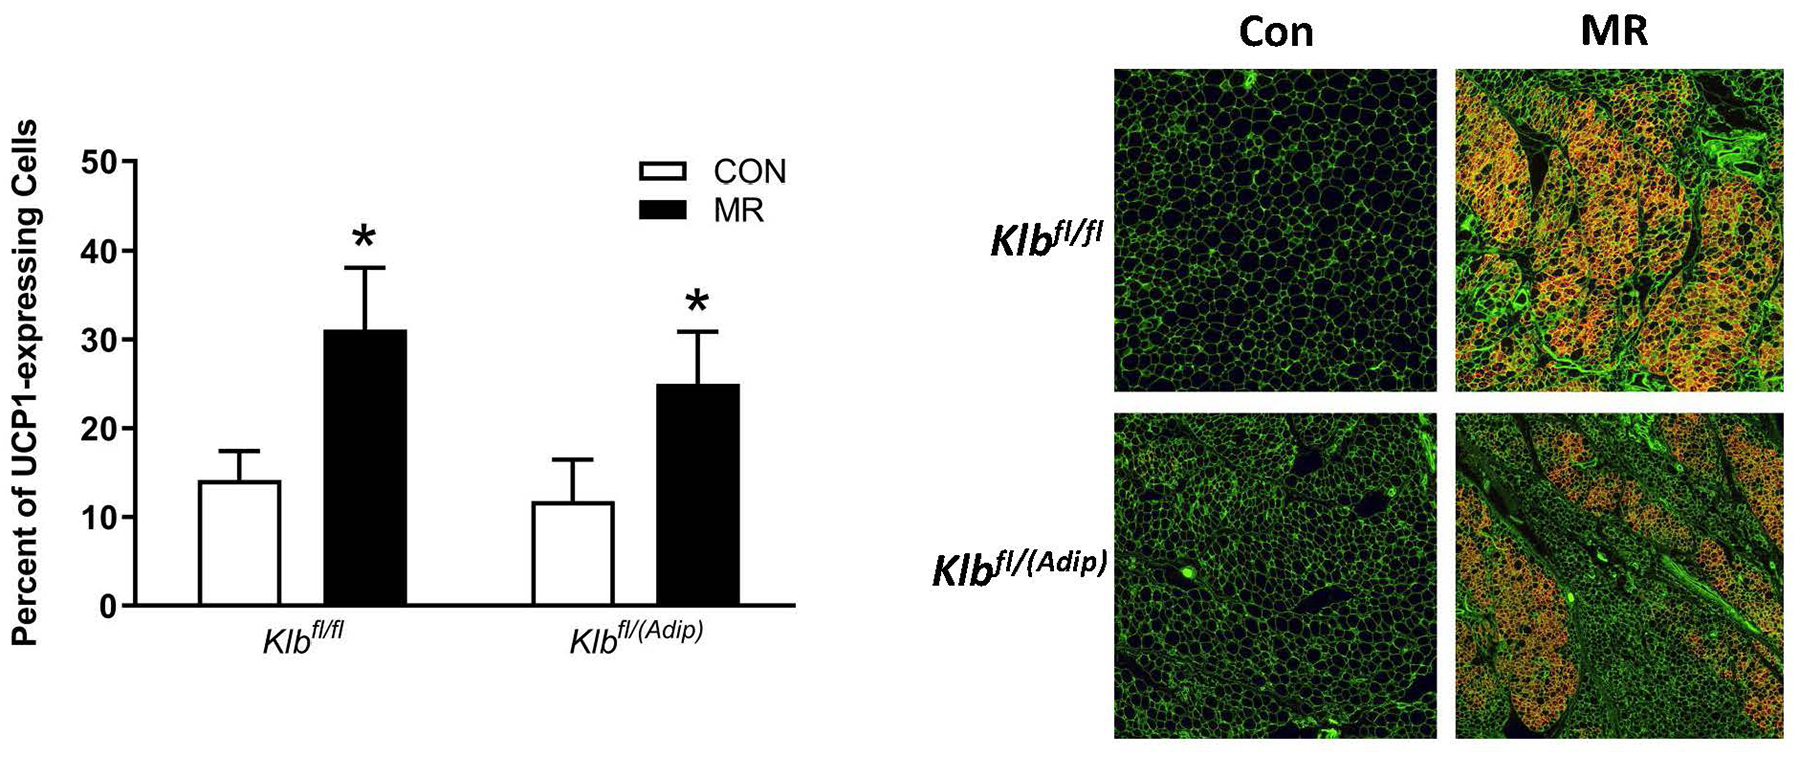
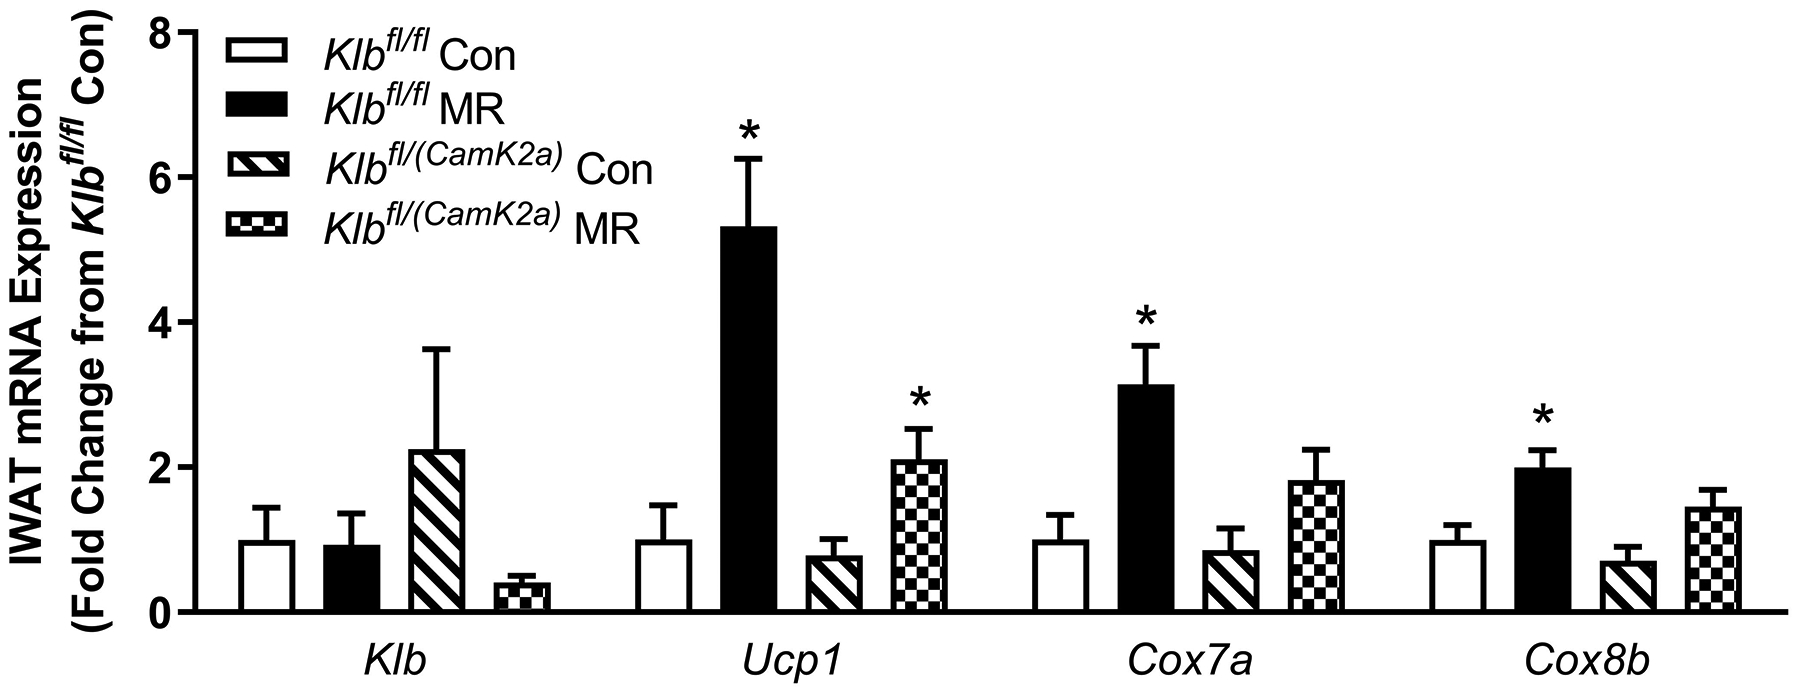
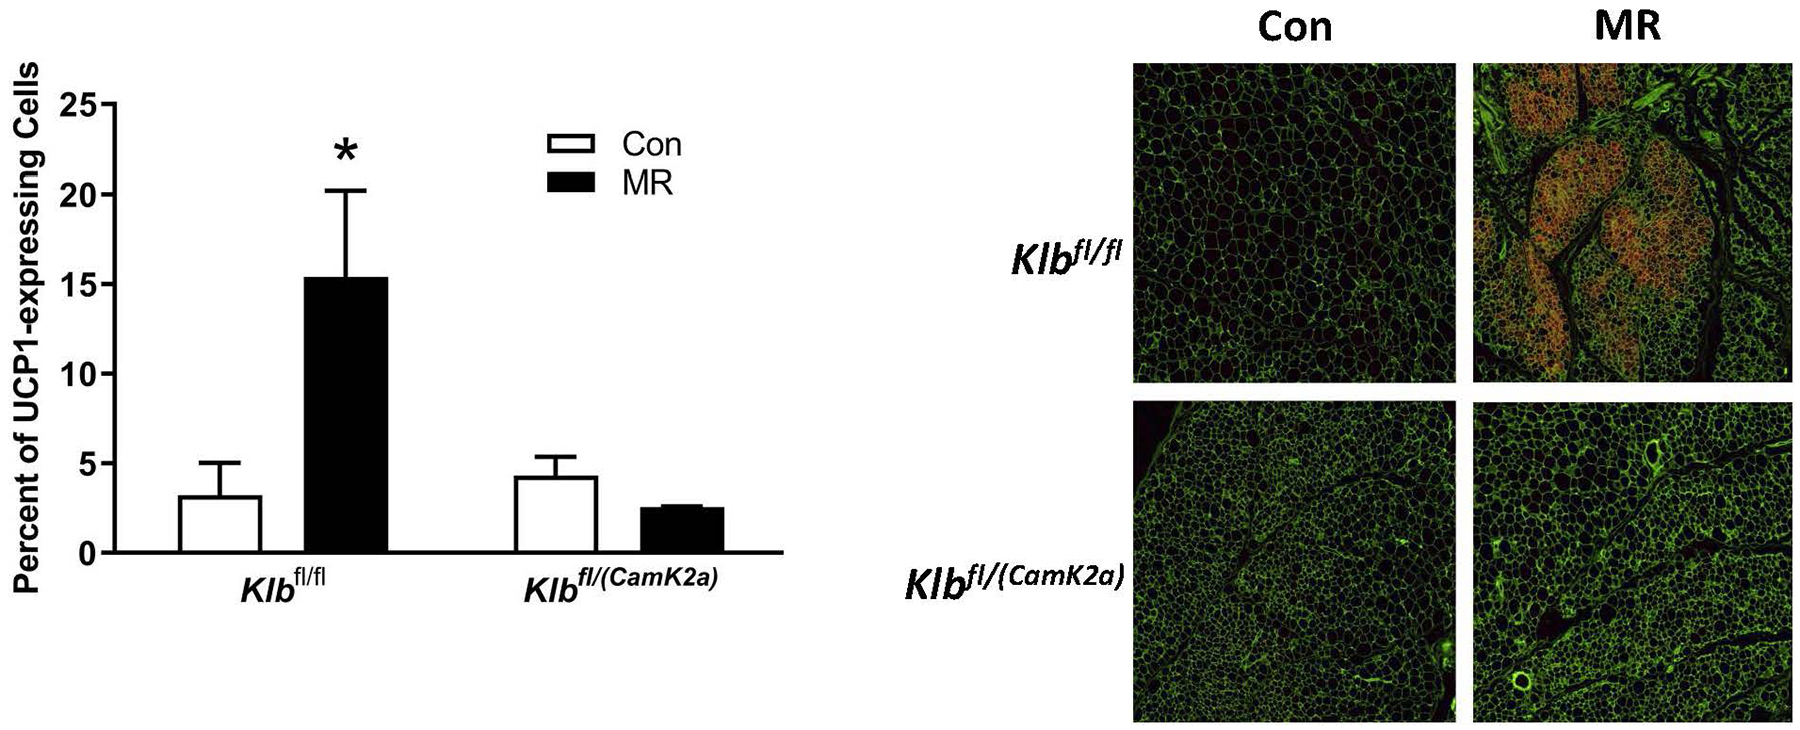
Figure 2 -. Transcriptional markers of browning and UCP1 protein expression in IWAT from Experiments 1 and 2.


Effects of MR on thermogenic gene expression in IWAT were measured via qPCR and expressed as fold-change relative to Klbfl/fl mice on the Con diet in Experiment 1 (Fig. 2A) and Klbfl/fl mice on the Con diet in Experiment 2 (Fig. 2D). Con - control; MR - methionine restricted diets; Klb - β-klotho; Ucp1 - uncoupling protein 1; Cox7a - cytochrome C oxidase subunit 7A; Cox8b - cytochrome C oxidase subunit 8B. Means for fold-change of gene expression denoted with an asterisk (*) differ from their corresponding genotype on the Con diet at p < 0.05. Effect of dietary MR on morphology and UCP1 expression in IWAT sections from Klbfl/fl mice and adipocyte-specific Klb knockout mice (Klbfl/(Adip)) from Experiment 1 (Fig. 2B) and in IWAT sections from Klbfl/fl mice and brain-specific Klb knockout mice (Klbfl/(CamK2a)) from Experiment 2 (Fig. 2D). IWAT sections from each genotype × diet combination were stained for UCP1 (red) and wheat germ agglutinin (green) for cell membranes. The percentage of the total cells in each section expressing UCP1 was determined in replicate sections (n=4) from each genotype × diet combination using Visiopharm software Cell Prolifer Software as described in the Methods. The percentage of UCP1-expressing cells in each group is presented in the accompanying bar graphs of Figs. 2B and 2D. Diet-induced differences within each genotype are denoted with an asterisk (P<0.05).
