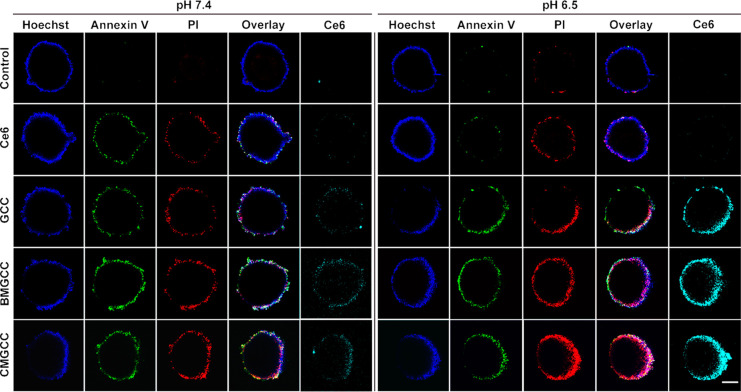
Figure 3.
CLSM images of 3D MCSs after treatment with Ce6, GCC, BMGCC, and CMGCC ([Ce6] = 0.5 μg/mL) with 660 nm laser irradiation (100 mW/cm2, 5 min) at pH 7.4 and 6.5. The cell nuclei, early apoptotic, and dead cells were stained with Hoechst, FITC-Annexin V, and PI, respectively. Scale bar = 250 μm.

