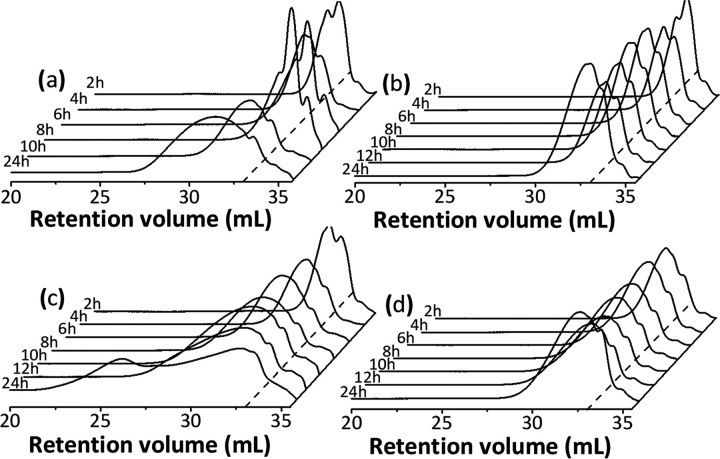
Figure 3.
GPC chromatograms illustrating the temporal evolution of the molecular weight and molecular weight distribution of the PGS prepared in (a) tetrahydrofuran, (b) tert-butanol, (c) acetone, and (d) acetonitrile at 40 °C. The dashed lines indicate the retention volume related to the PS standard with the lowest molecular weight (1050 g mol–1) at 33 mL.

