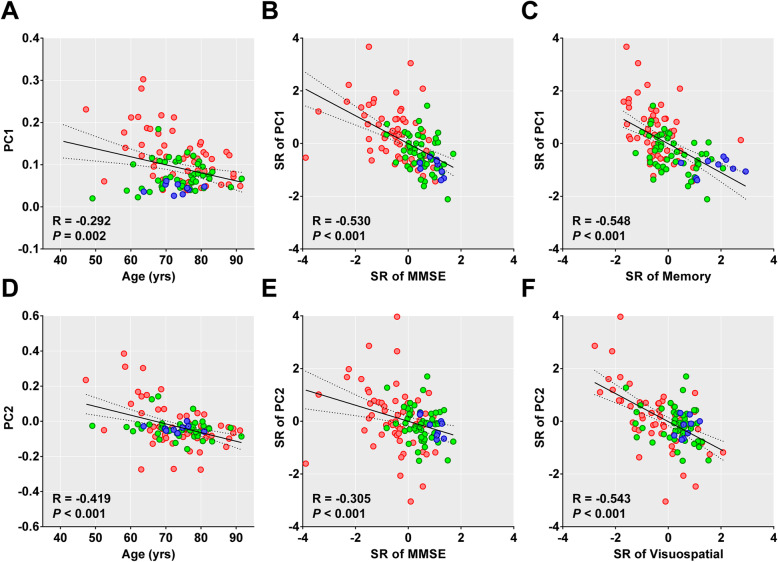
Fig. 3.
Age-related changes in the PC scores and their correlation with cognitive function in 114 Aβ-positive individuals. The colors of the circles represent individual clinical status (blue = CU, green = MCI, and red = dementia). Pearson’s correlation lines (solid), 95% confidence interval lines (dotted), correlation coefficients (R), and P values are presented within each plot. PC, principal component; MCI, mild cognitive impairment; CU, cognitively unimpaired; SR, standardized residuals obtained by linear regression analysis with age, years of education, sex, and presence of ApoE ε4 allele as covariates

