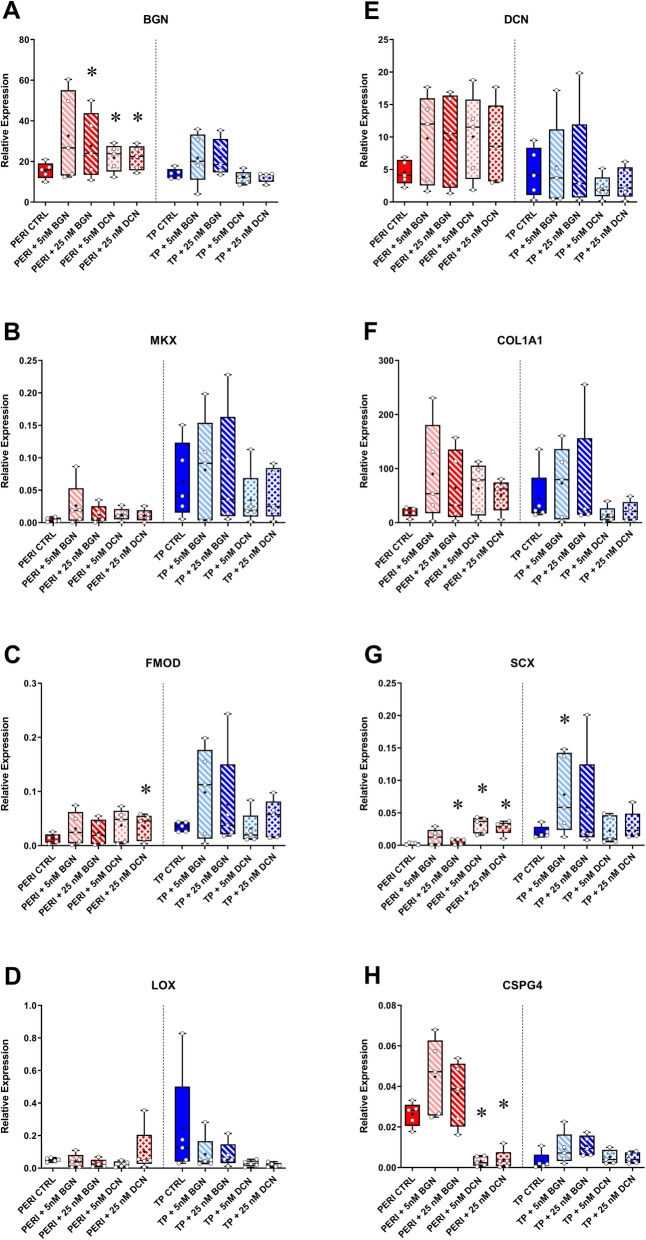
Fig. 5.
RT-qPCR analysis of perivascular and tenogenic markers. For each gene, the gene expression was plotted against the housekeeping gene POLR2A. TP: tendon proper cells; PERI: peritenon cells; CTRL: no bBGN or bDCN supplementation. Expression is plotted in a box and whisker plot with “+” representing the mean, box representing first-third quartile, line representing median, and whisker representing range. Significance is based on one-sided nonparametric Wilcoxon signed-rank tests predicting improvement: *, significant as p ≤ 0.05, relative to the respective TP or PERI control; n = 5

