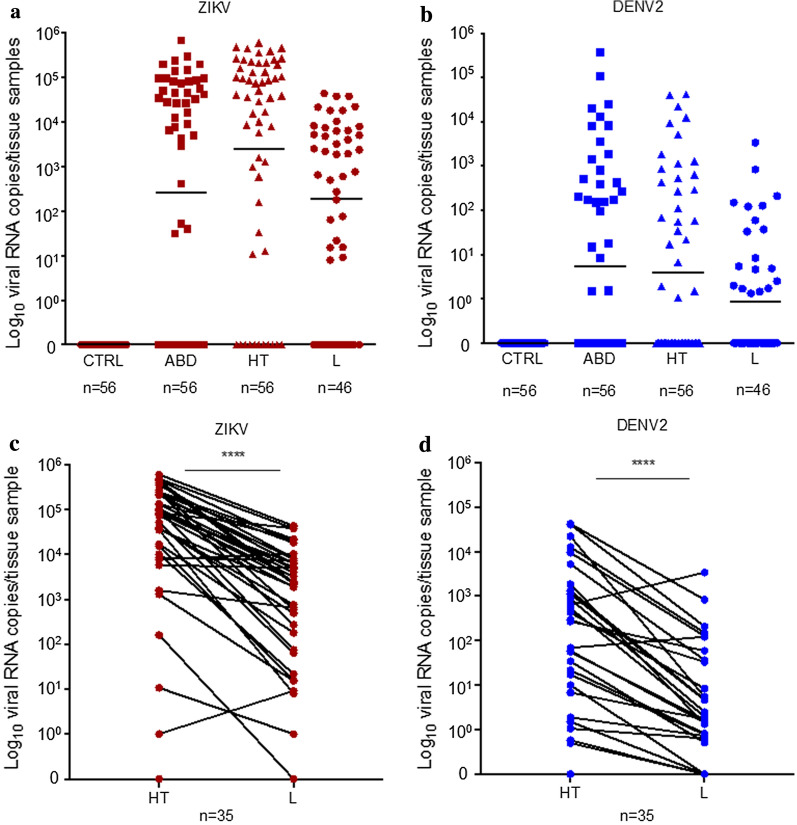
Fig. 3.
Viral RNA concentrations of individual Ae. aegypti tissues collected at various time points. Individual Ae. aegypti that were infected with Zika (a) and dengue virus (b) and collected at 7 or 14 days post-infectious blood meal. Squares represent abdomens with midgut samples (ABD) collected on day 7 post-infectious blood meal to measure the viral loads in the midgut stage. Triangles represent head with thorax samples (HT) and circles represent corresponding leg (L) samples were collected on day 14 to evaluate the disseminated viral loads. Uninfected Ae. aegypti are included as negative controls. The vertical axis represents RNA viral genome copy number per tissue sample derived from absolute standard curve. Infected Ae. aegypti (n = 46) were collected and identical samples of head with thorax (HT) and legs (L) were amplified for Zika virus (c) and dengue virus serotype 2 (d) using bCUBE-based qRT-PCR. Each circle represents individual mosquito tissue amplified by bCUBE qRT-PCR. The vertical axis represents RNA viral genome copy number derived from standard curve. Infection status was compared (****P < 0.0001; paired two-tailed t-test). Abbreviations: ABD, abdomen with midgut; HT, head with thorax

