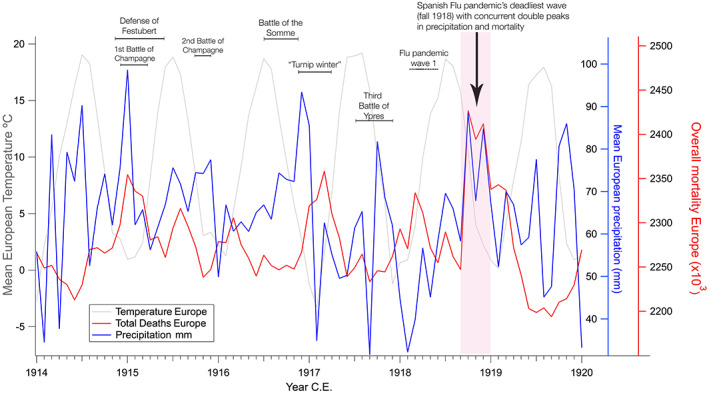
Figure 3.

Mean temperature, precipitation, and total deaths in Europe, 1914–1920. Mean values of instrumental measurements of temperature and precipitation with overall deaths for 13 European countries (Ansart et al., 2009; Bunle, 1954; Schneider et al., 2014; Willmott & Matsuura, 2001). In the autumn and winter of 1918, mortality peaked together with high precipitation, with a peak in both records in the month of October, a slight decrease in November, and another peak in December of that year. The deadliest wave of the Spanish Influenza pandemic claimed most of its victims in the same months, where the arrow points to a double peak in both deaths and precipitation.
