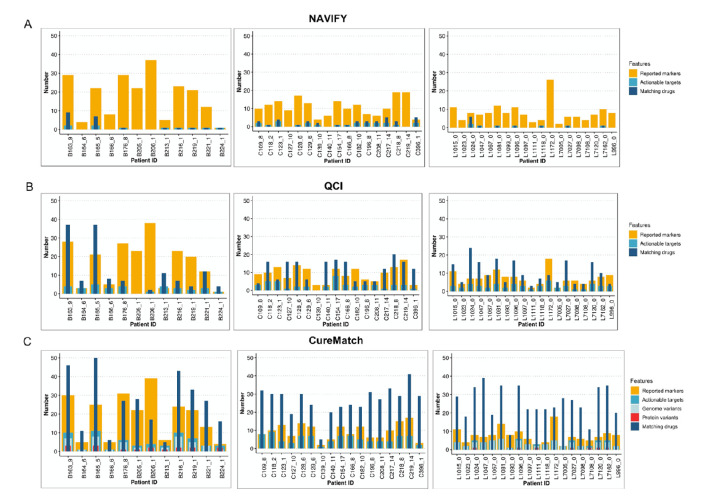
Figure 3.
Reported markers, actionability and number of treatment suggestions. (A–C) Stacked bar charts from NAVIFY (A: top), QCI (B: centre) and CureMatch (C: bottom) per patient and per tumour entity (left, BC; centre, CRC; right, NSCLC). Reported markers (orange) represent all alterations reported to the clinical decision support tool, whereas actionable targets (turquoise) are those alterations which were successfully matched to a therapy. Matching drugs (dark blue) correspond to the total number of drugs identified for each patient's molecular profile. In the CureMatch analysis, the actionable targets in the BC and NSCLC samples could be categorised as either a genome (light blue) or protein variant (red). BC, breast cancer; CRC, colorectal cancer; NSCLC, non-small-cell lung cancer.QCI, QIAGEN Clinical Insight.

