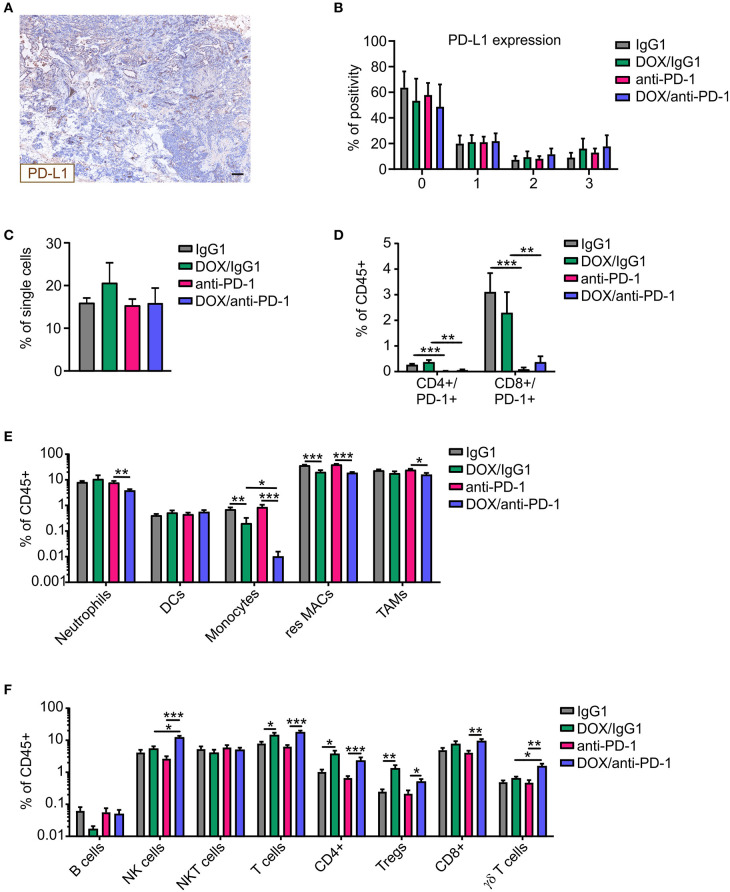
Figure 2.
Altered immune cell composition in PyMT tumors upon chemoimmunotherapy. PyMT tumor-bearing animals were treated with either anti-PD-1 or doxorubicin (DOX) plus anti-PD-1 and the corresponding IgG1 antibody control. PyMT tumor sections (n ≥ 4) were stained for PD-L1 as well as for DAPI (nuclei) and analyzed using Phenoptics™. (A) Representative image shows PD-L1 expression for a doxorubicin (DOX) plus anti-PD-1 section. Scale bar: 100 μm. (B) Quantification of PD-L1 percentage positivity using the inForm® software with a 4-bin scoring algorithm (0, lowest expression; 3, highest expression). The relative frequencies of (C) CD45+ immune cells within total single cells and (D) CD4+/PD-1+ and CD8+/PD-1+ T cells (E) myeloid cell subsets as well as (F) lymphoid cell subsets relative to total CD45+ immune cells are displayed (IgG1: n = 17, anti-PD-1: n = 16, DOX/IgG1: n = 10, DOX/anti-PD-1: n = 9). Data are means ± SEM, p-values were calculated using unpaired t-test or Mann–Whitney test according to D'Agostino & Pearson omnibus normality test; *p < 0.05, **p < 0.01, ***p < 0.001.

