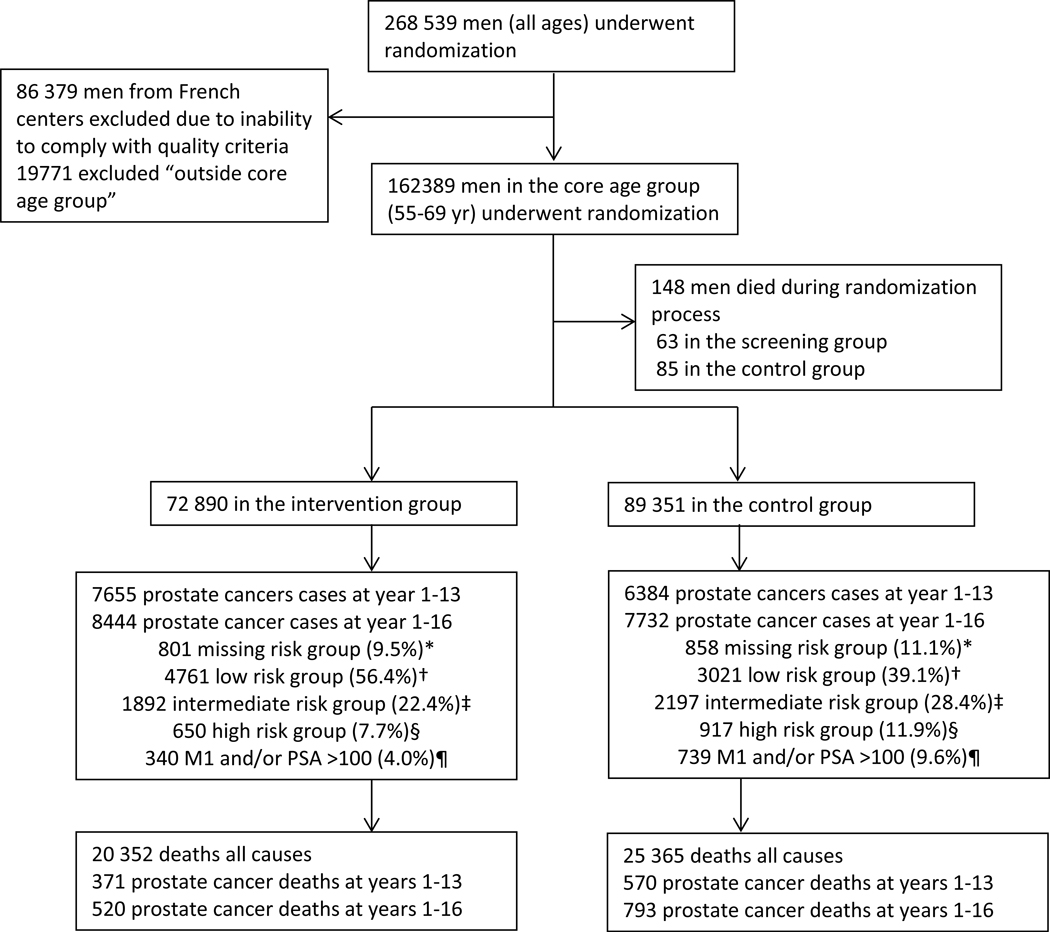
Figure 1: Trial profile (core age group).
GS=Gleason score. M1=evidence of metastases on imaging or PSA >100 ng/mL. PSA=prostate-specific antigen. *Missing=missing T stage or GS, not M1 or PSA <100. †Low risk= T1, and T1 with GS ≤6. ‡=Intermediate risk= T1, and T2 with GS 7 and T3 with GS ≤7. §High risk= T1, and T2, and T3 with GS 8-10 and T4 with any GS. ¶ M1 or PSA >100 might occur, any T stage, or GS.

