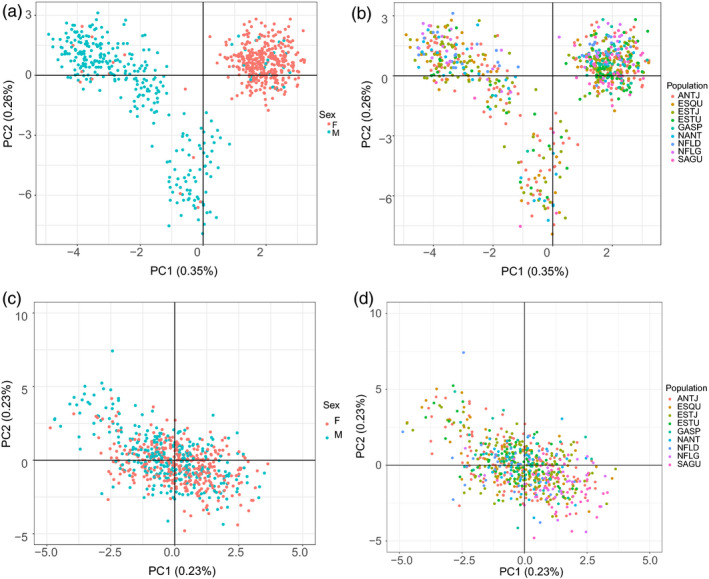
FIGURE 4.

Principal component analysis (PCA) using (a) and (b) dataset including sex‐linked markers and (c) and (d) the dataset without sex‐linked markers. Females are colored in pink and males in blue in (a) and (c) and individuals are colored by population in (b) and (d)
