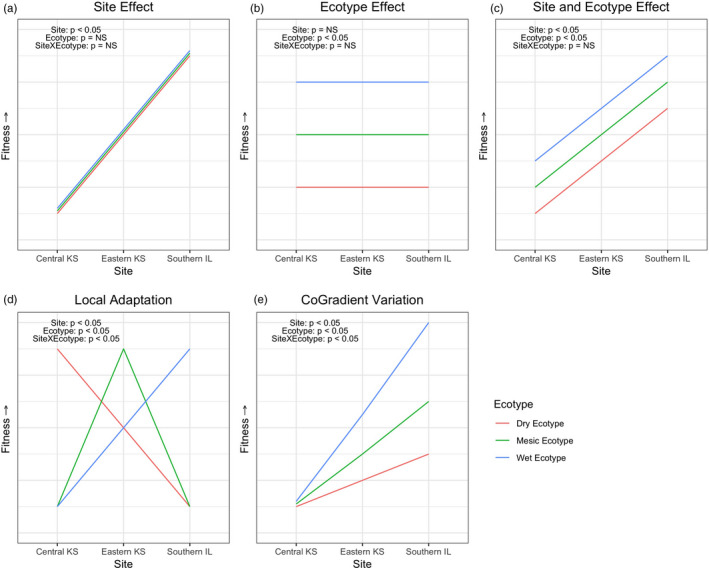
FIGURE 1.

(a) Main effect of site S only, (b) main effect of ecotype E only, (c) main effects of site S and ecotype E, no interaction, (d) local adaptation S × E, (e) co‐gradient variation. Illustration of plausible phenotypic patterns of S and E effects, represented by ecotypes across an environmental gradient
